LexisNexis: Product Color Exploration & Data Visualization
From 2023 to 2024, I redesigned the charts and graphs across LexisNexis products, creating a 22-color palette that works in light and dark mode and meets WCAG standards.
From 2023 to 2024, I redesigned the charts and graphs across LexisNexis products, creating a 22-color palette that works in light and dark mode and meets WCAG standards.
Charts across LexisNexis products looked and behaved differently, and many did not meet WCAG standards. I set out to unify them. The result is a 22-color palette and a family of charts that stay consistent, readable and accessible in both light and dark mode.
Identifying the problem and research I explored the primary law products and the extended products connected to them to see how each chart was designed and how it behaved. I found both simple and complex charts that needed to be redesigned.
Collaboration and Feedback I sought feedback from other designers with deep expert knowledge of Lexis Nexis products to make the charts meet WCAG standards, and I shared progress updates weekly and monthly.
Designing the Solution I designed a 22-color categorical palette, plus conditional palettes for complex charts, that meet WCAG standards.
Chart and Color Integration I worked with UX and visual designers to bring the new charts into each primary law product. We started small, then expanded to the extended products.
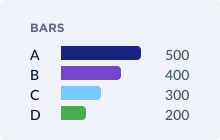
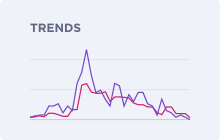
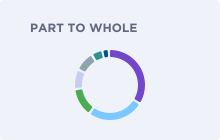
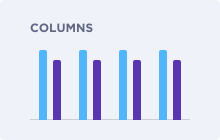
I designed a variety of charts that can be visually integrated into Lexis Nexis’s core products, both primary law and extended. Each chart was designed for responsive scaling and the ability to switch between light and dark mode.
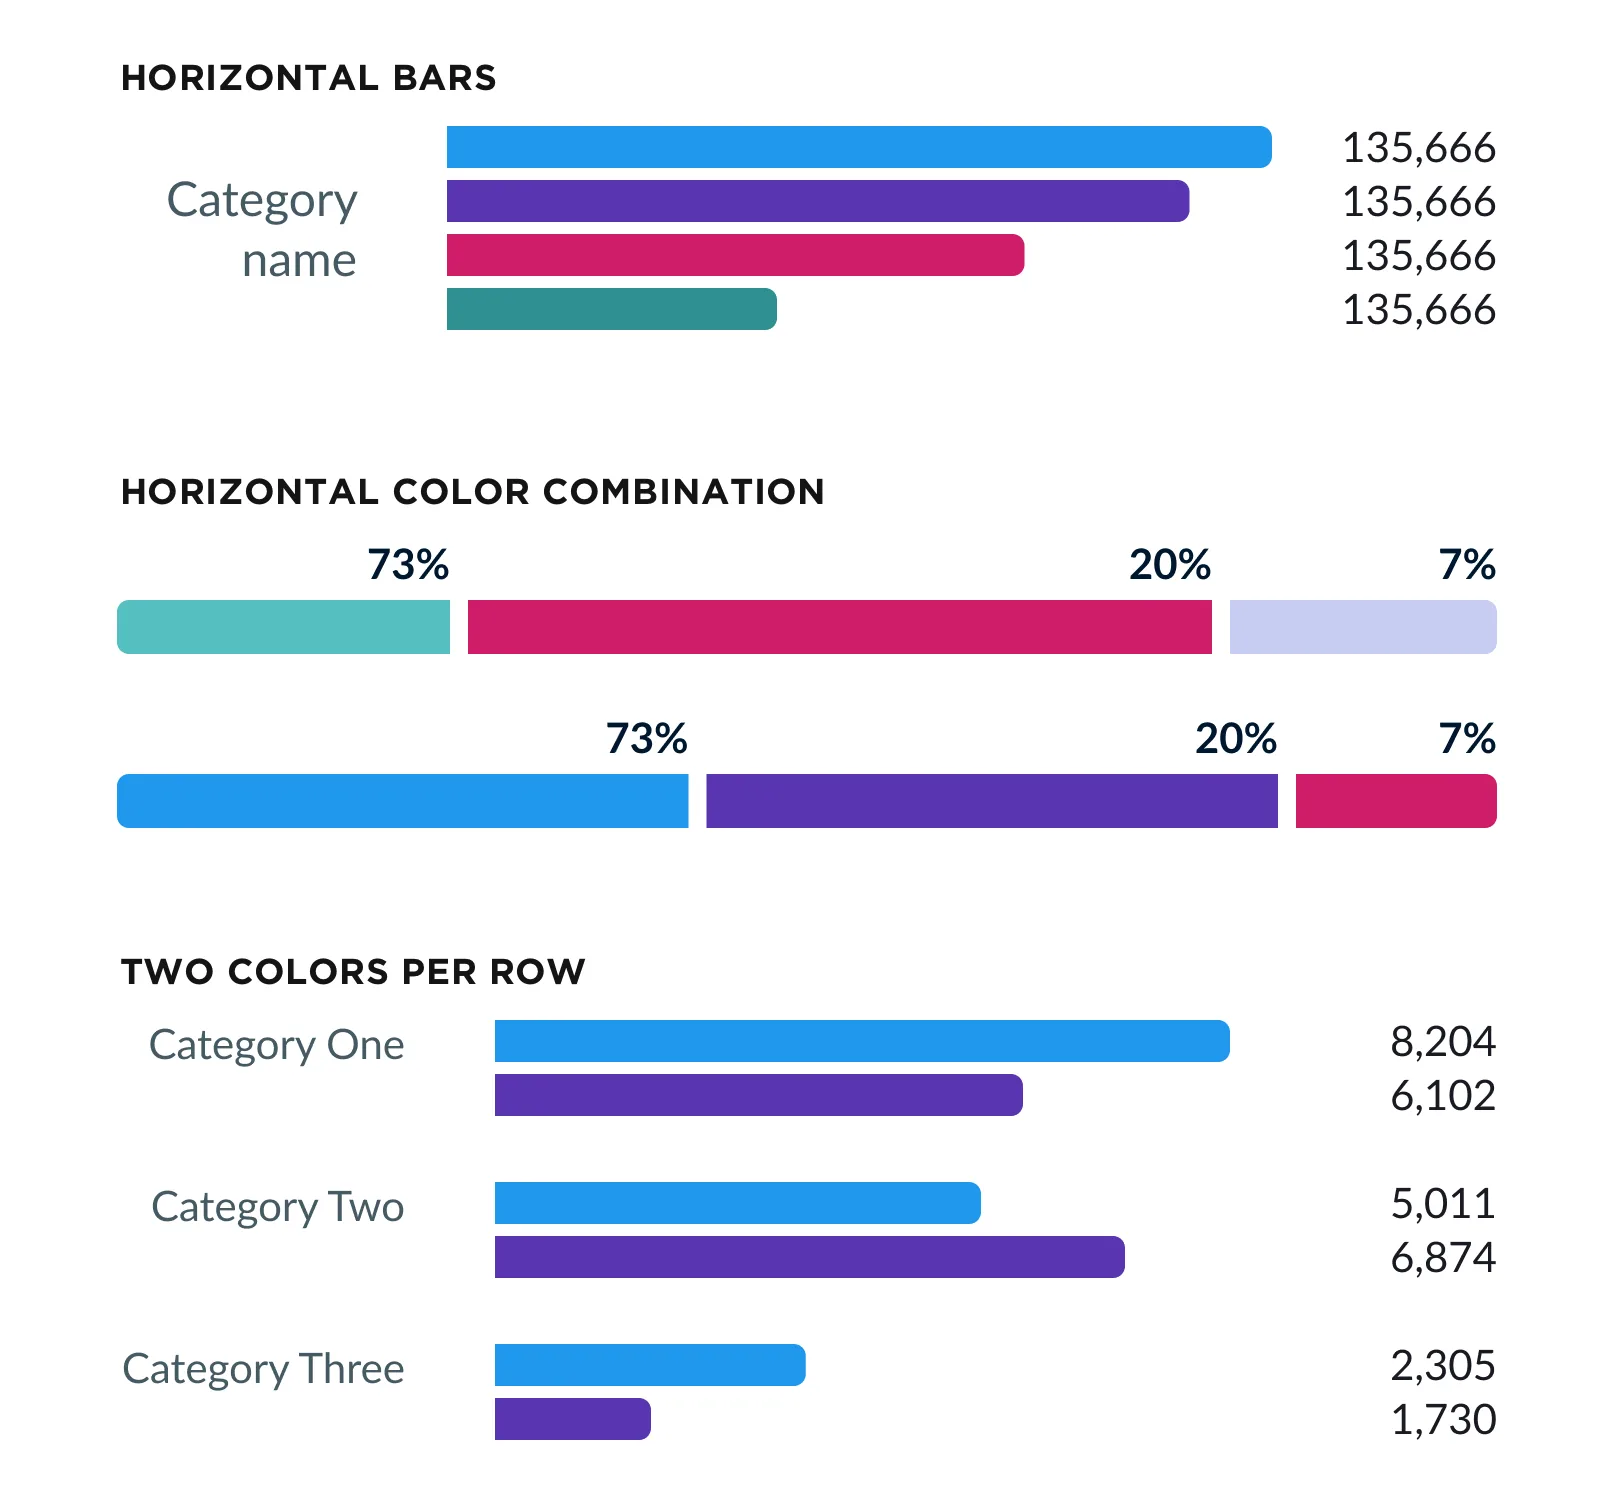
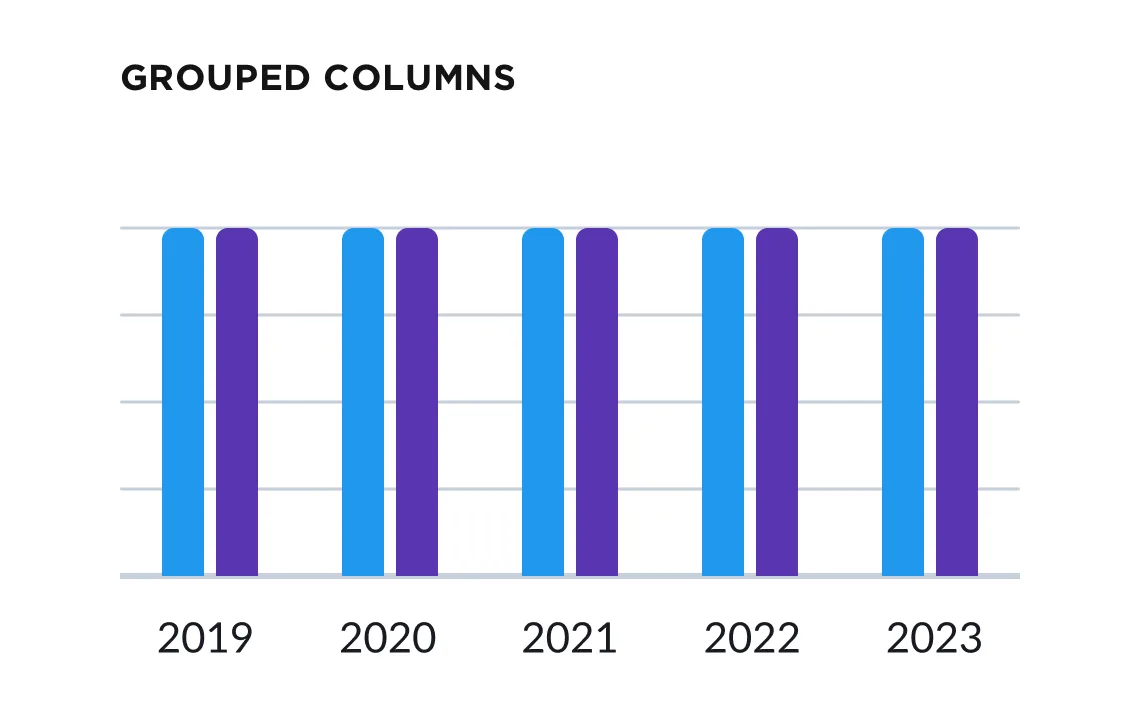
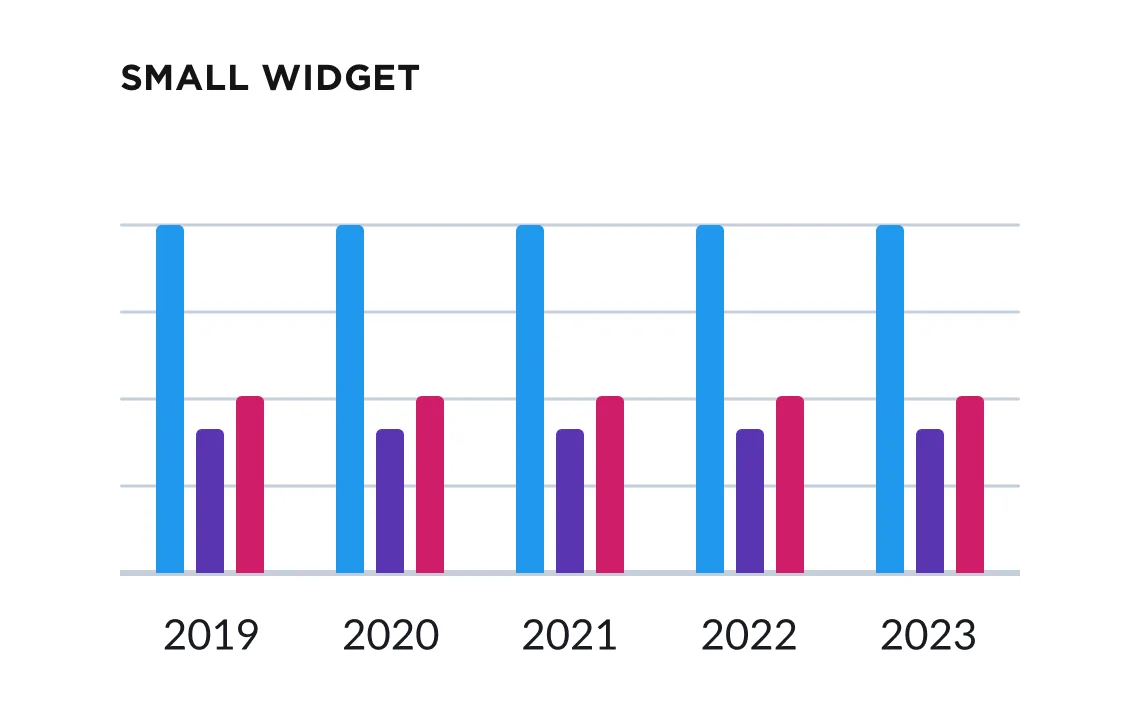
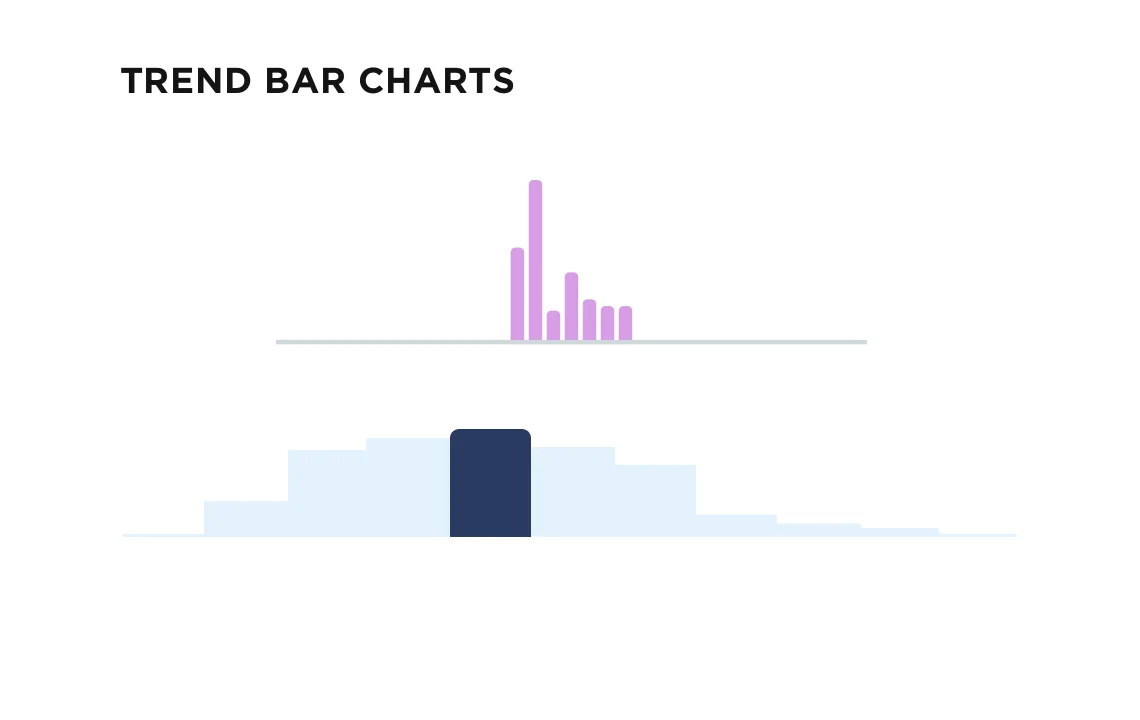
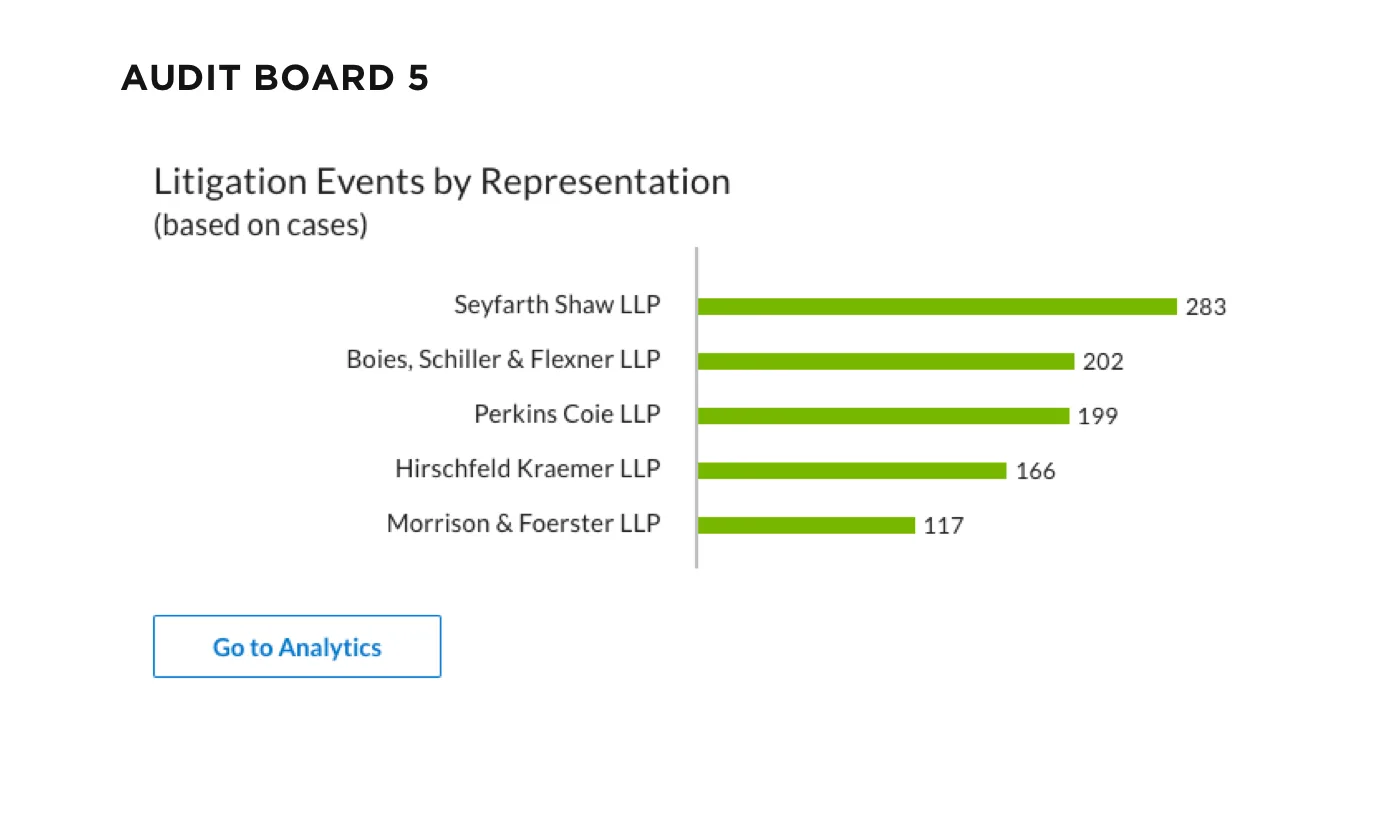
I designed bar charts in several layouts, from single series to grouped and two-color rows, so they scale to widgets of any size.
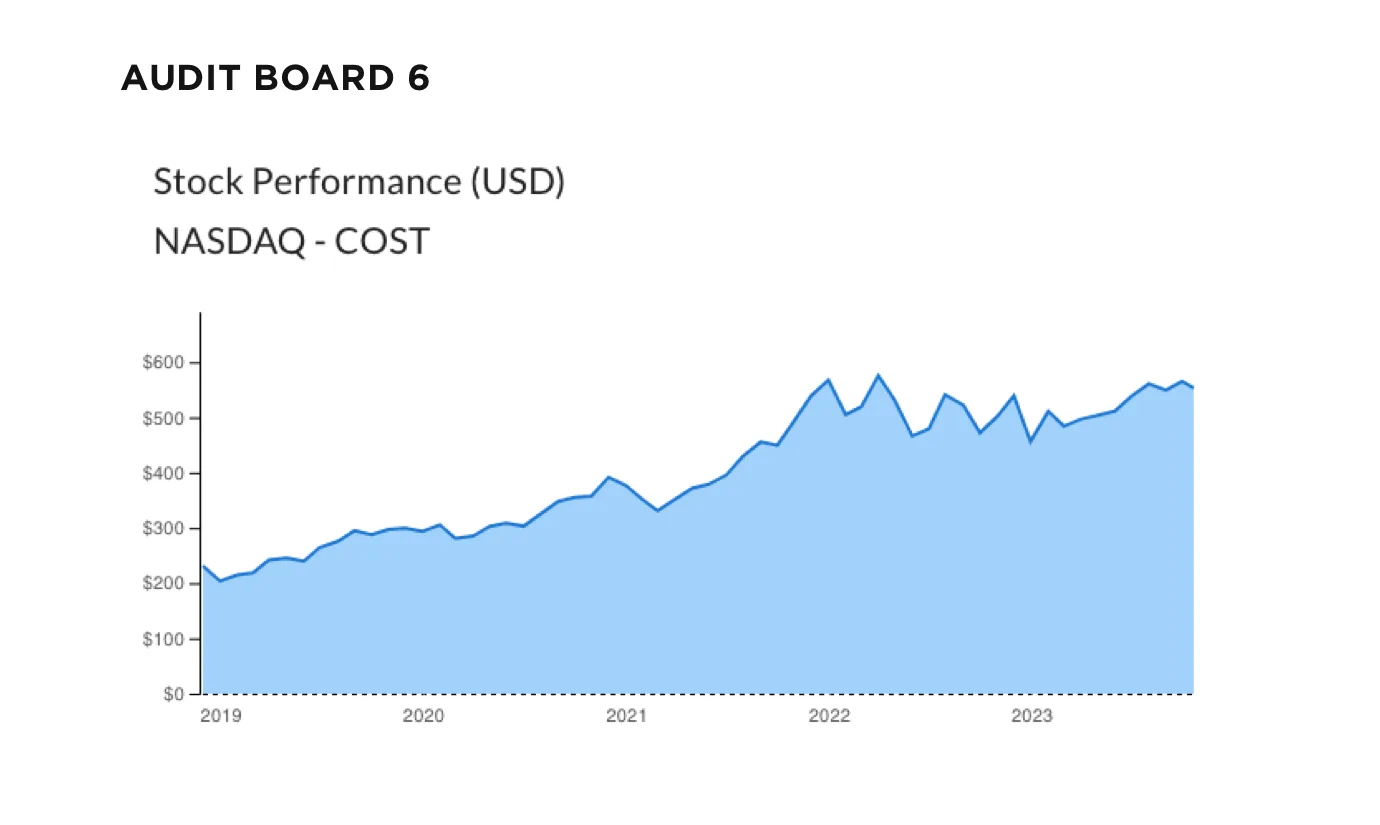
Line charts in Lexis Nexis products can appear simplistic or complex depending on the type of search. I designed each line chart to be interactive upon hovering and clicking.
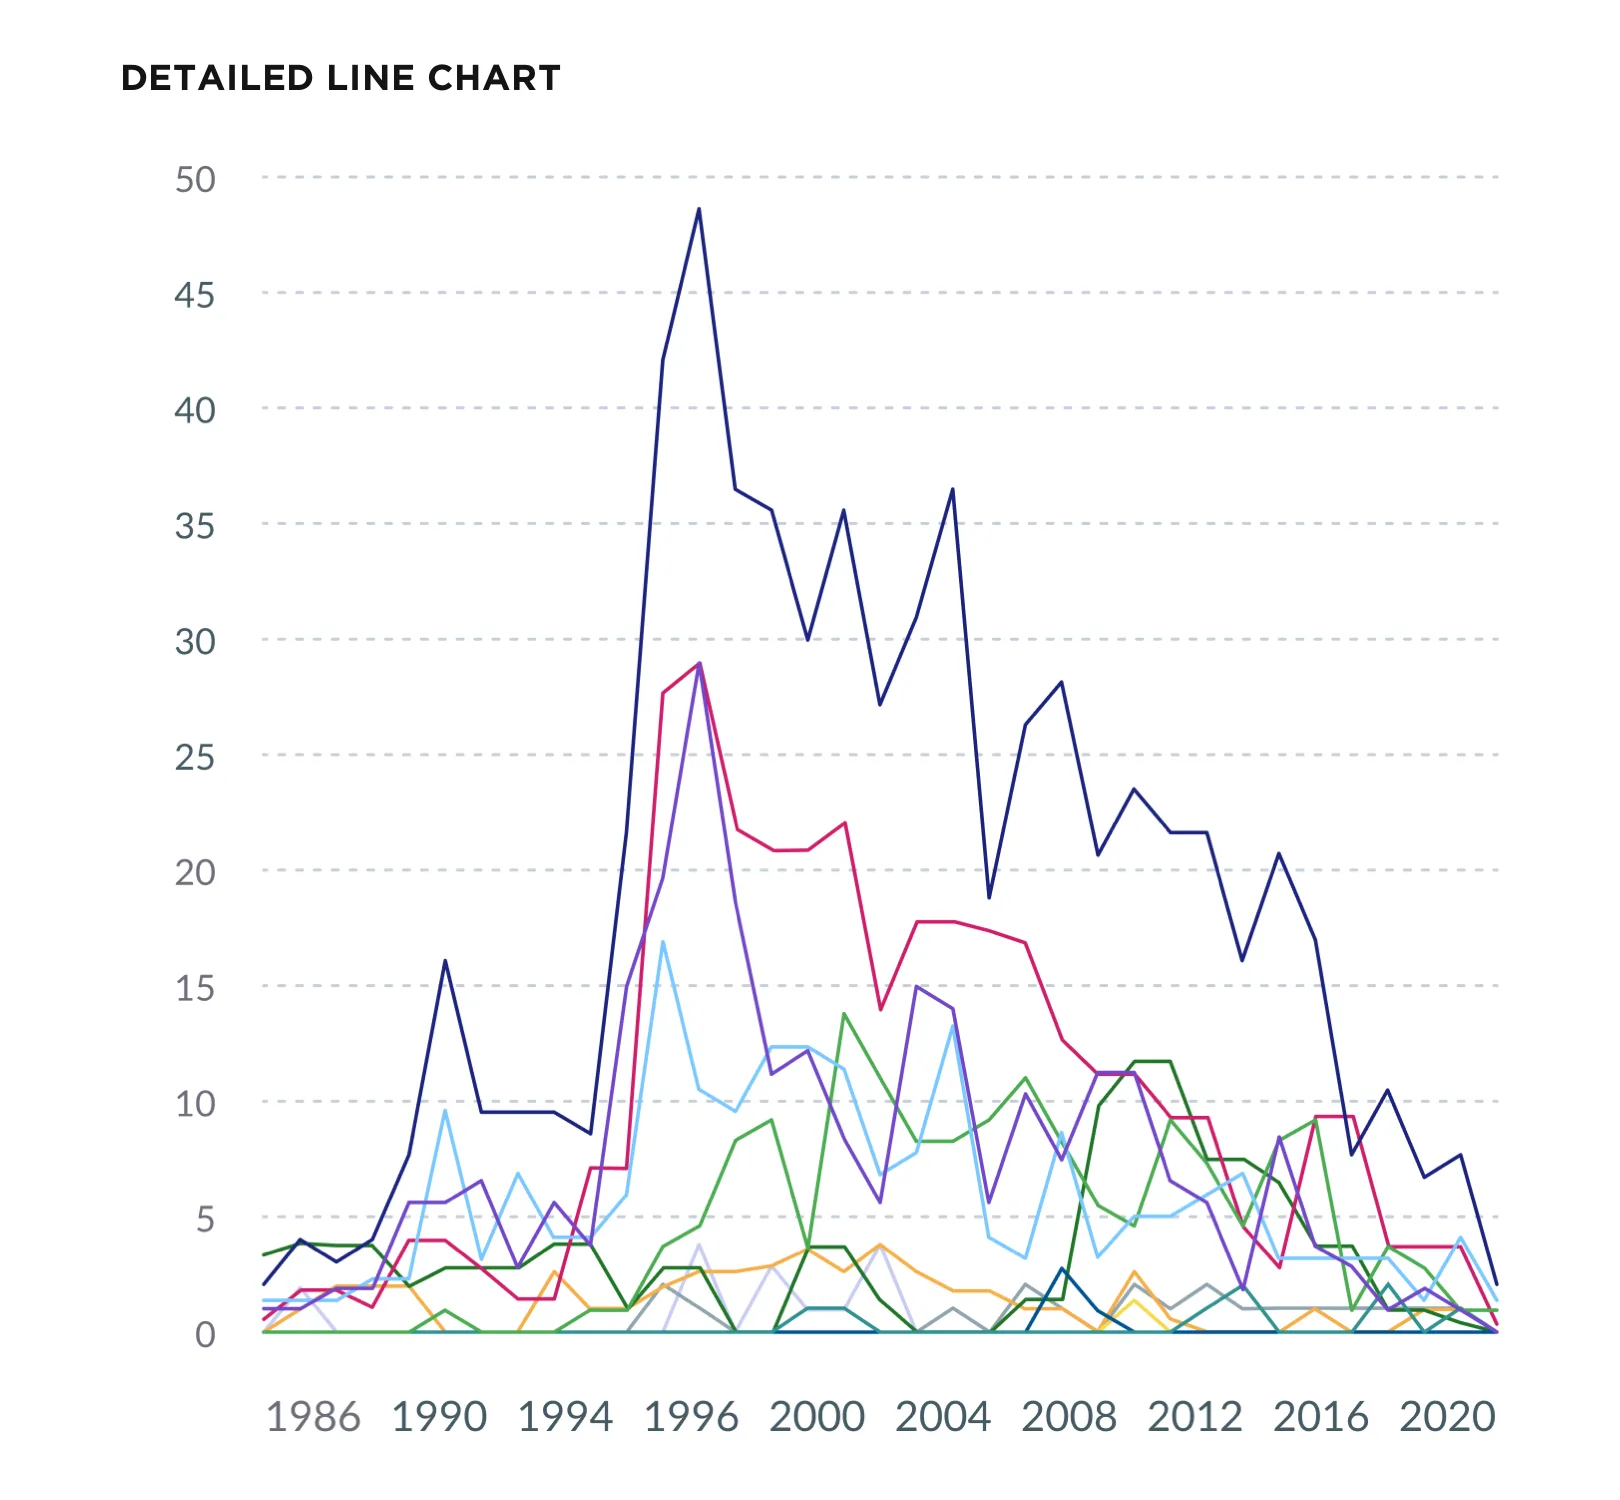
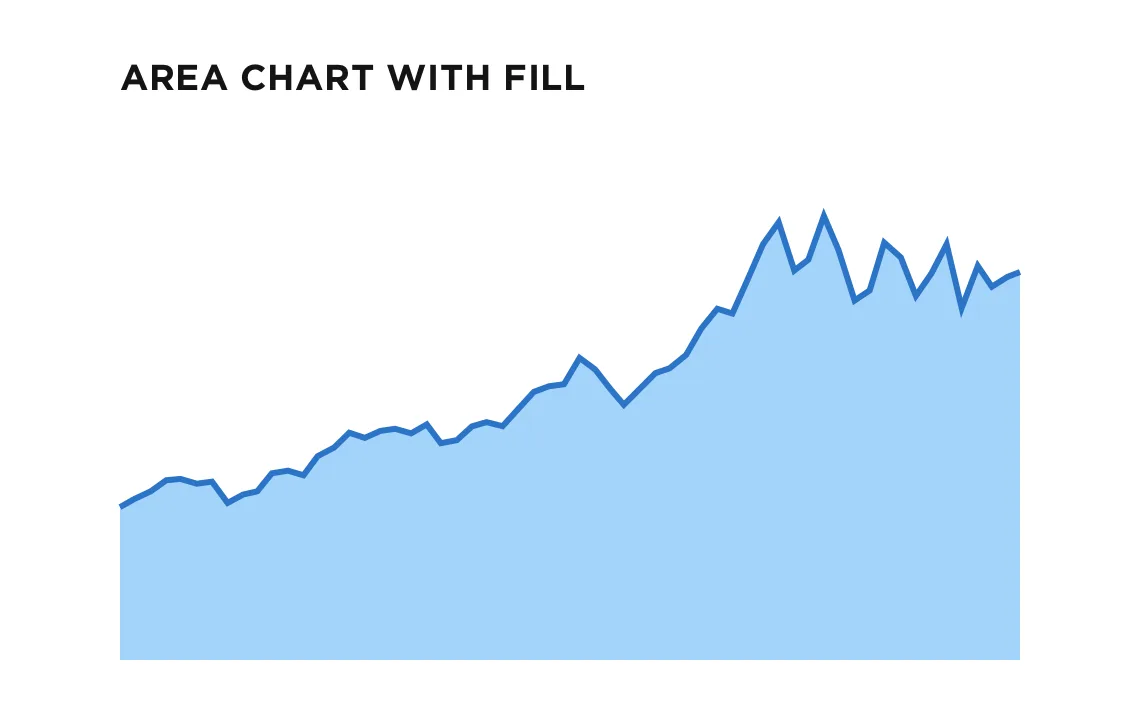
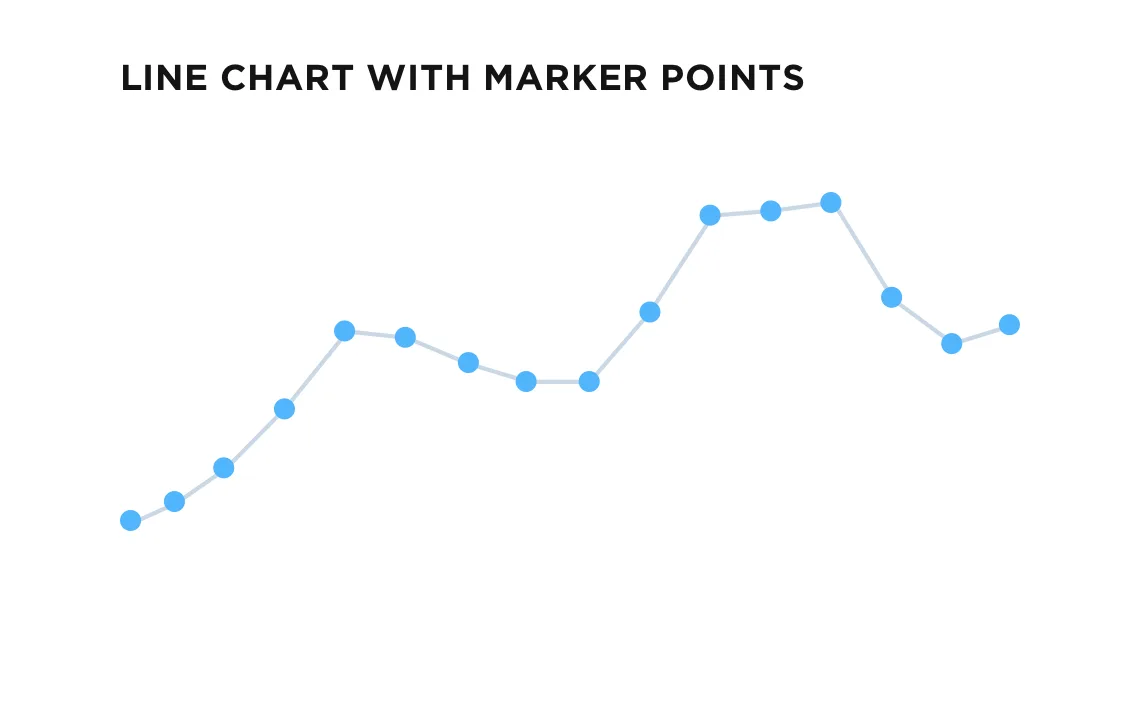
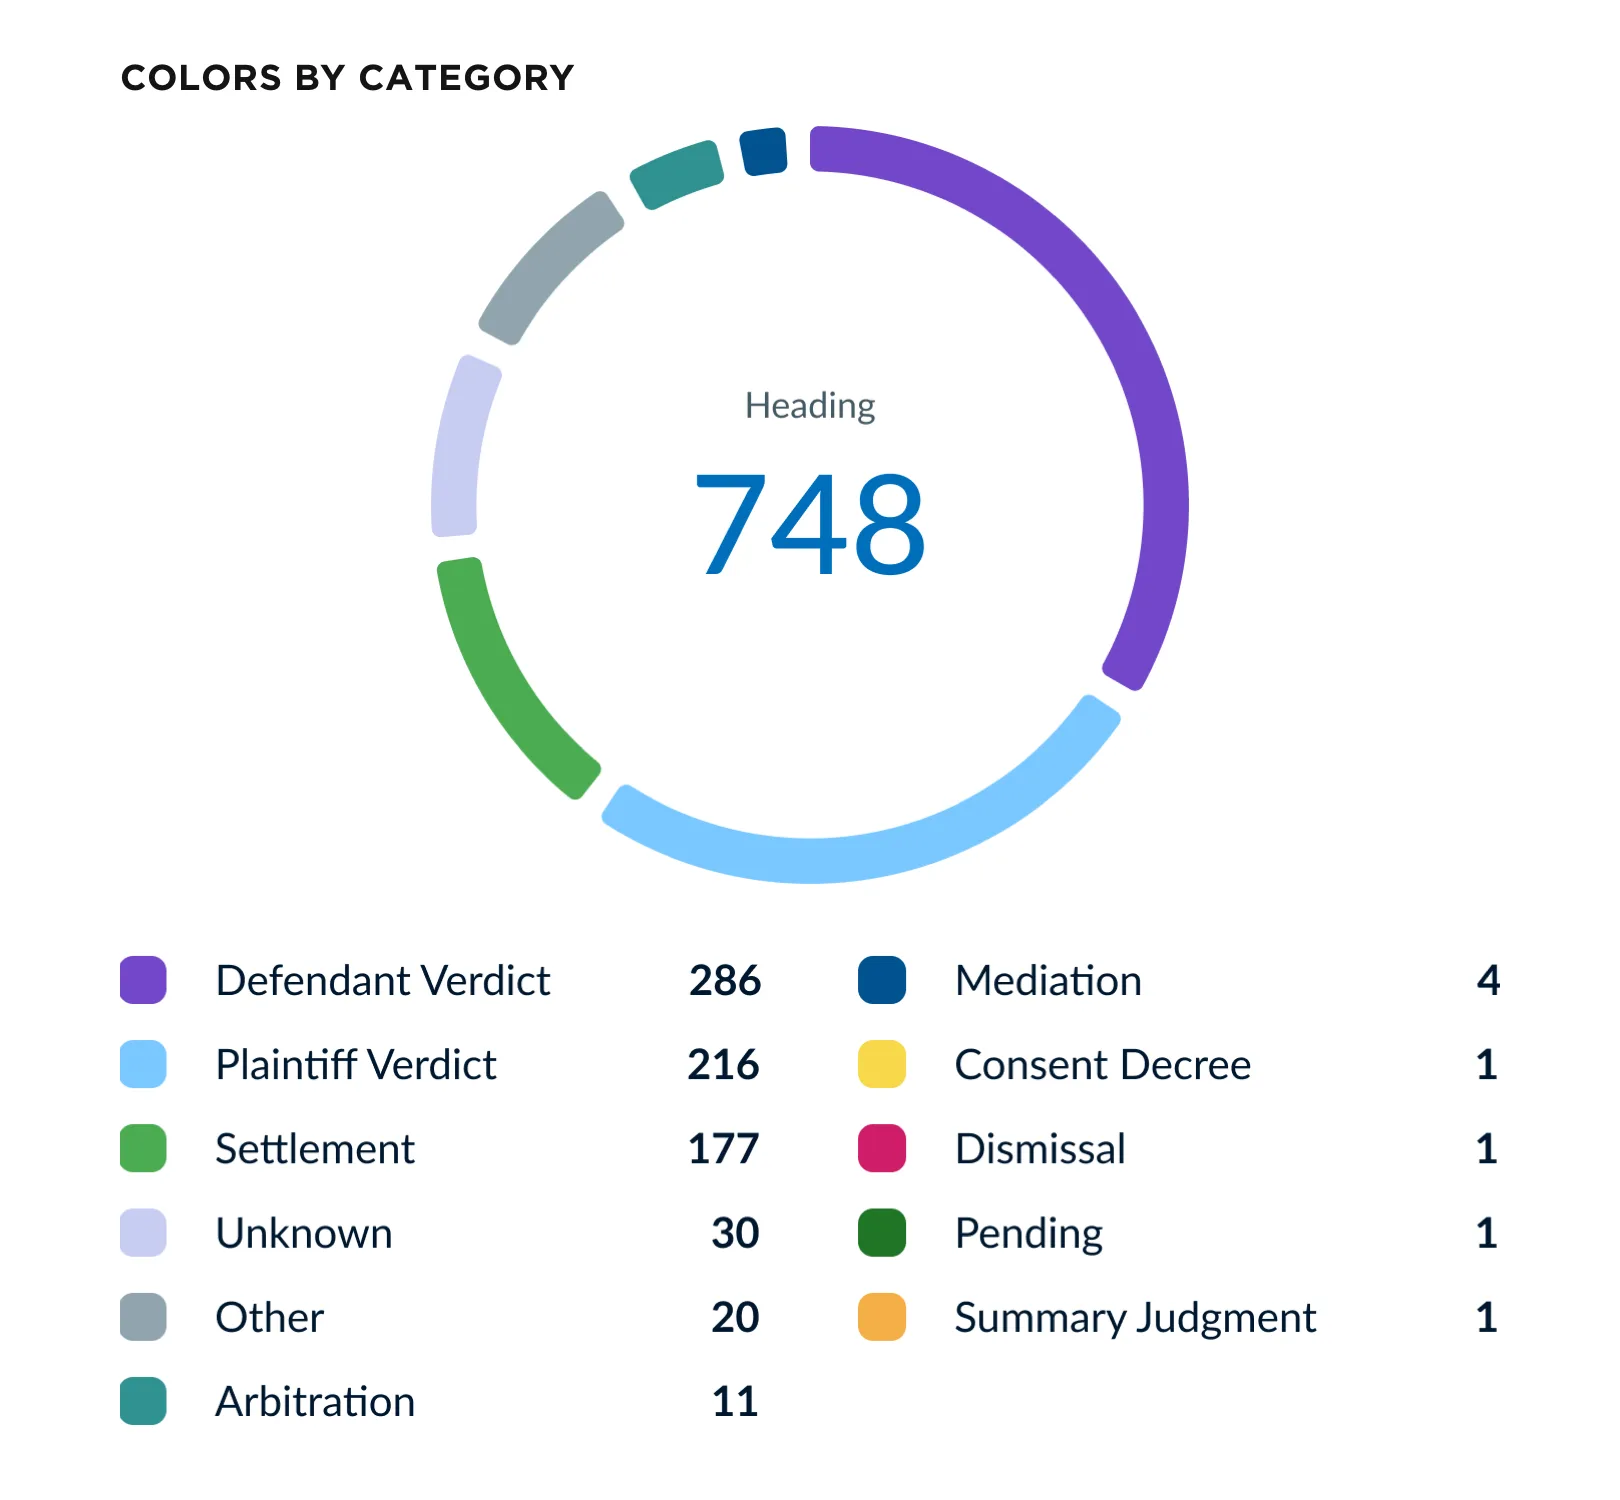
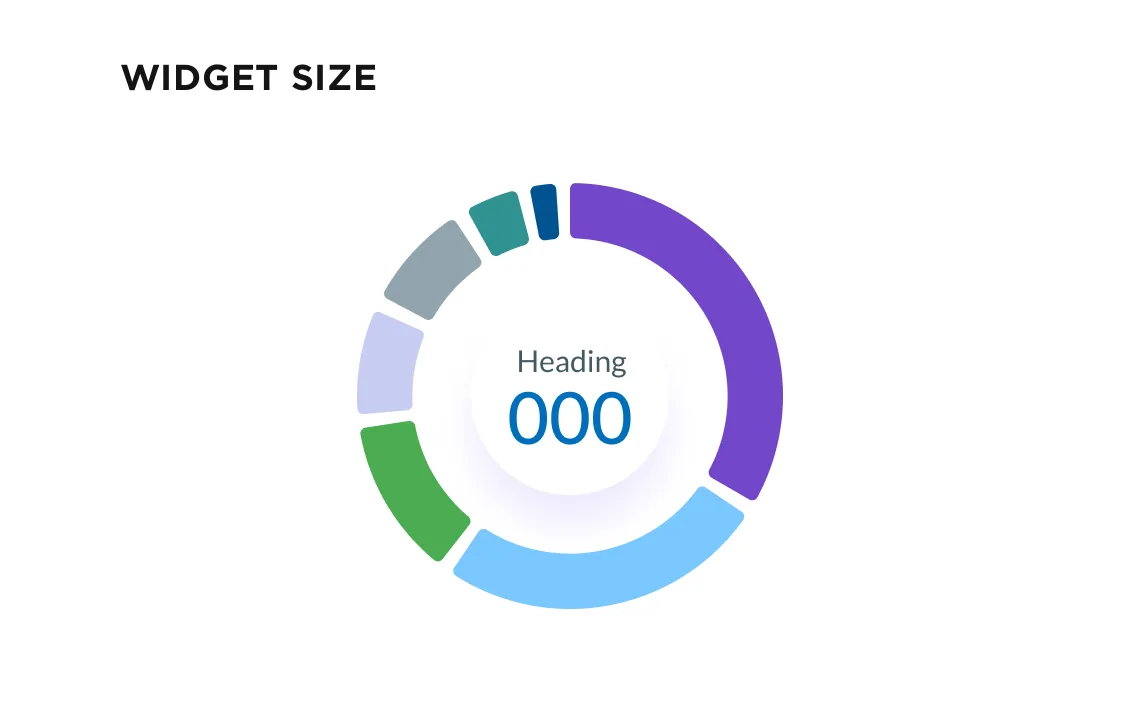
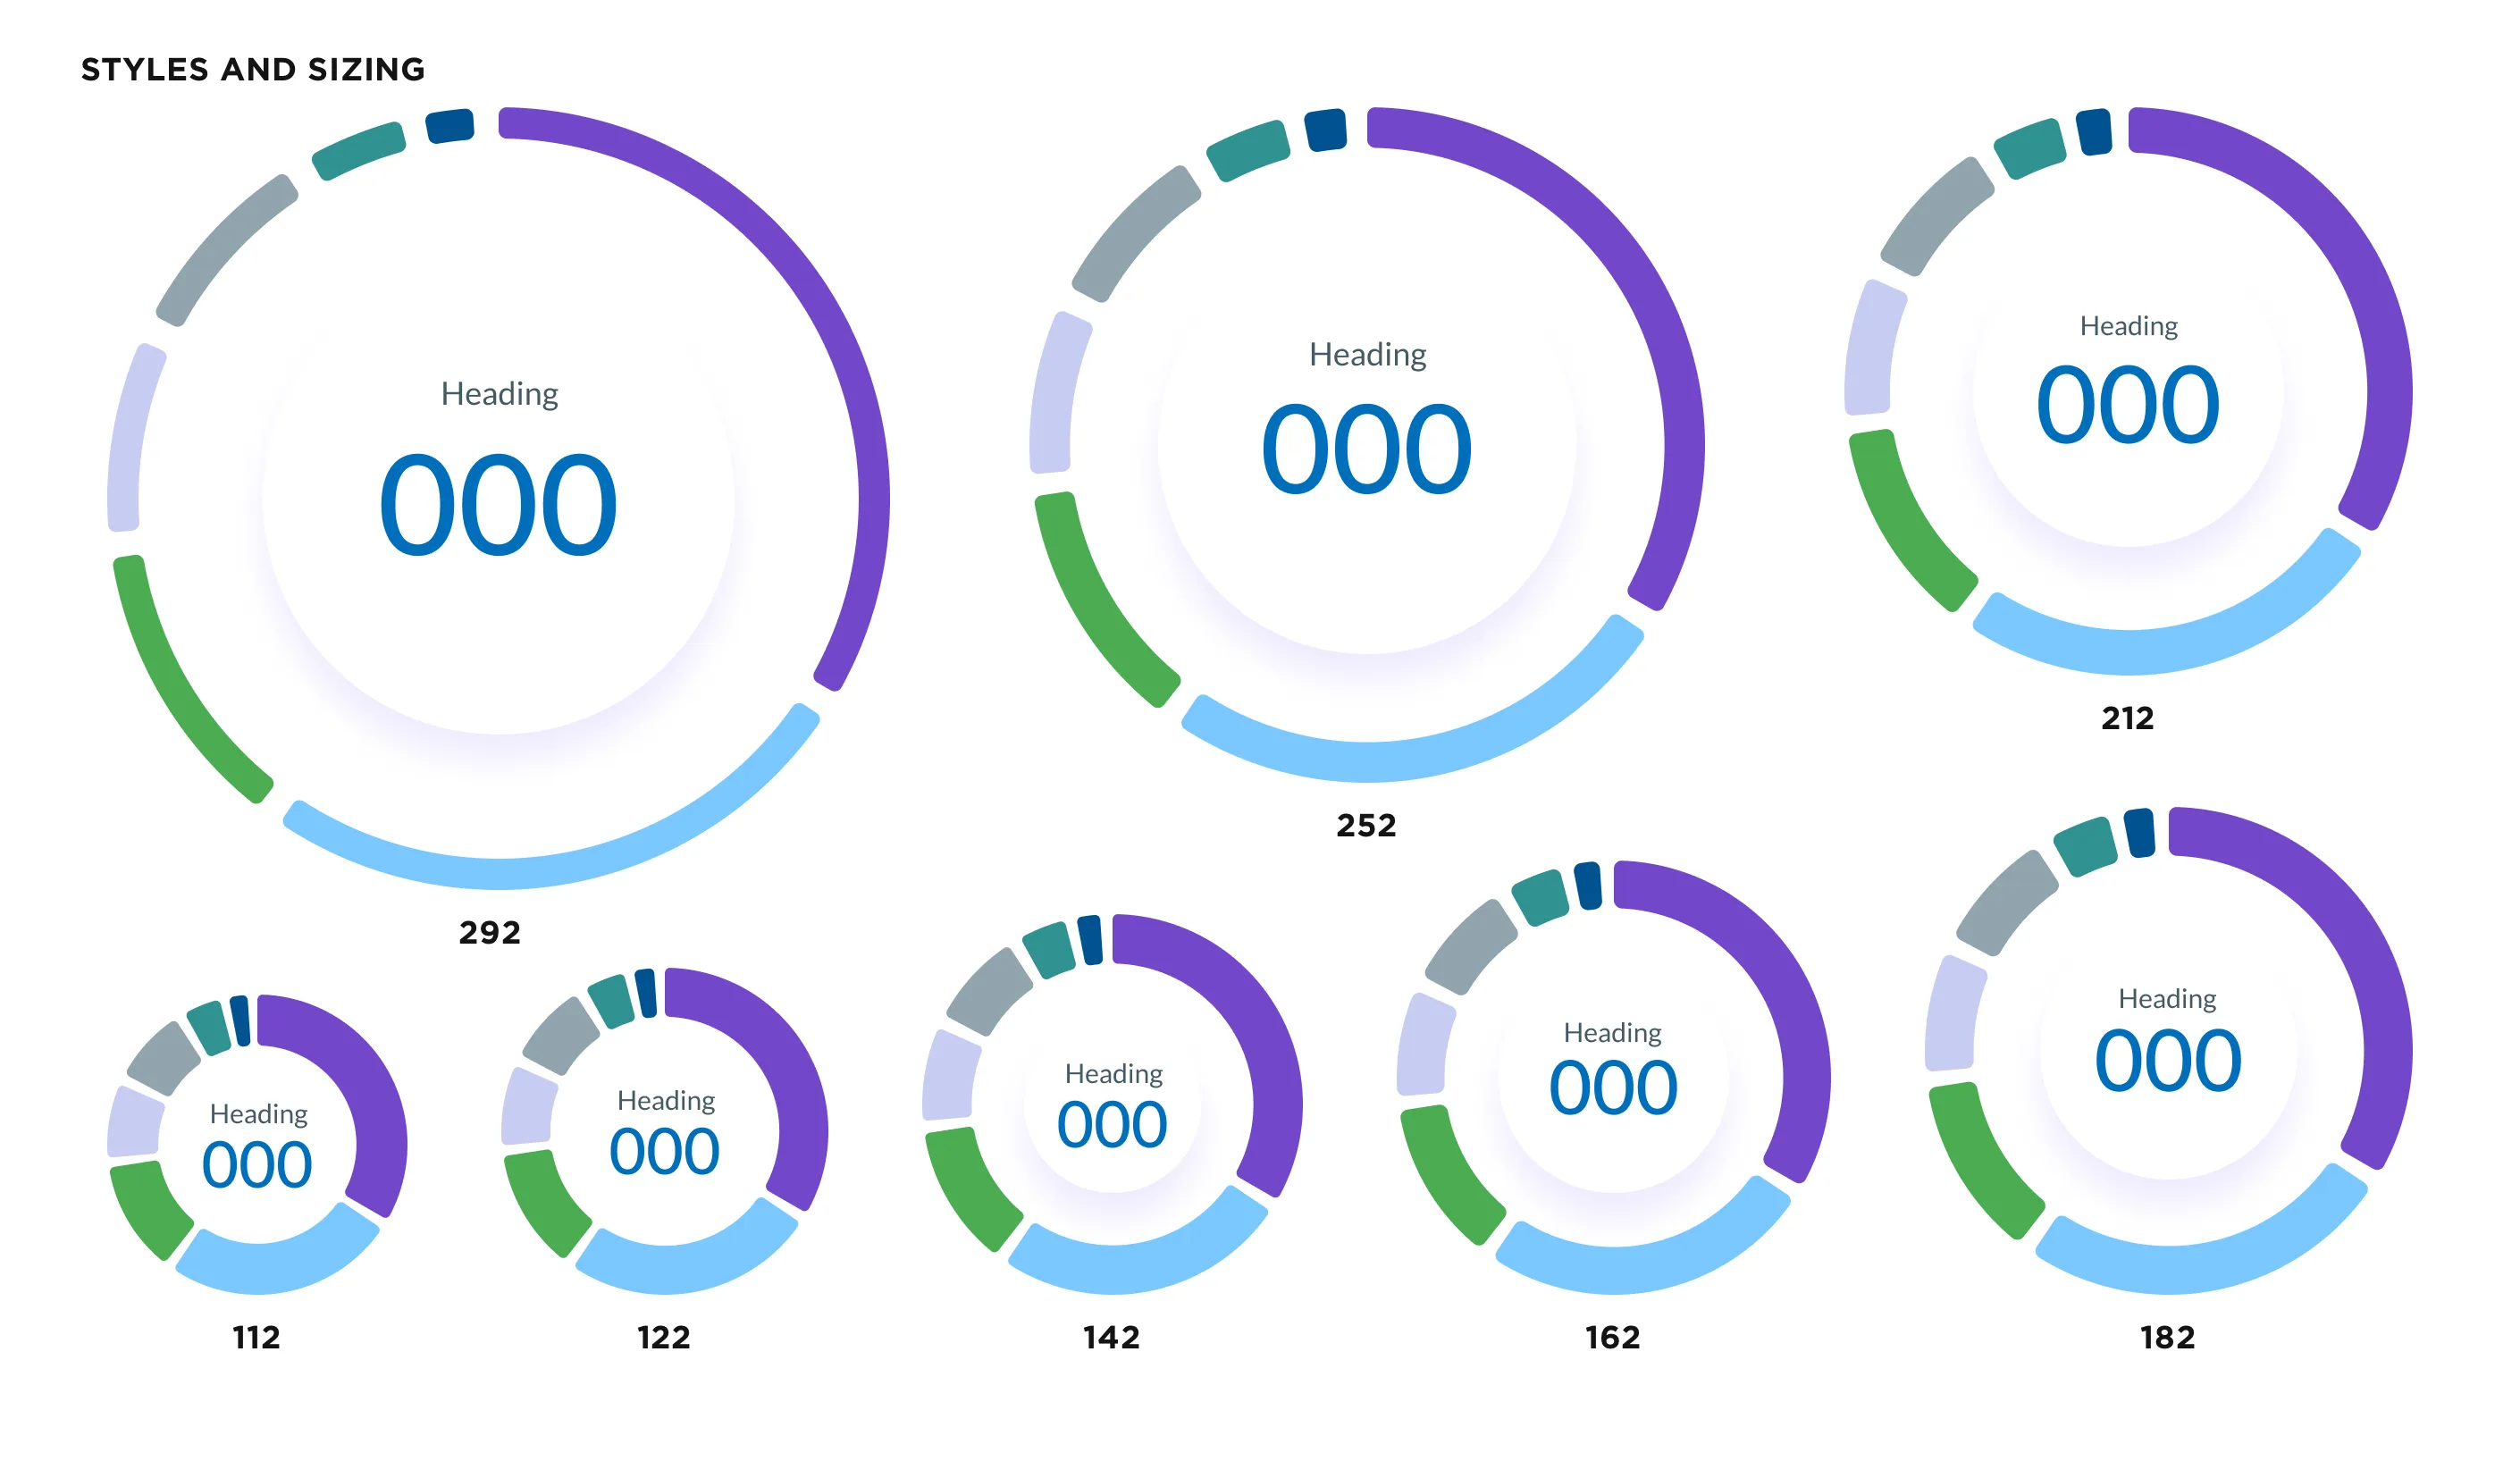
I designed donut charts and conditional styles for many data scenarios so they work in any product.
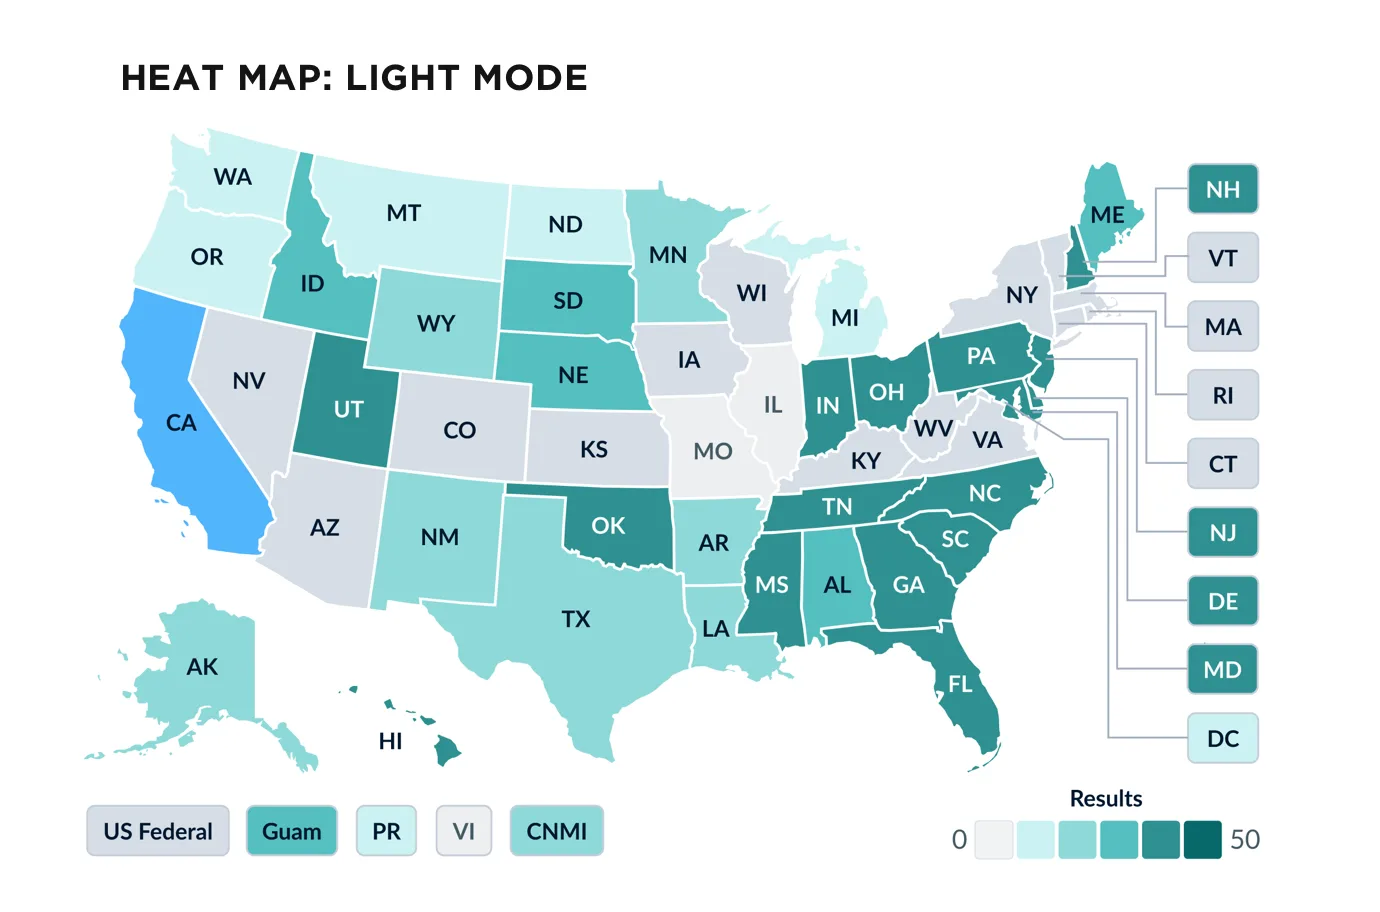
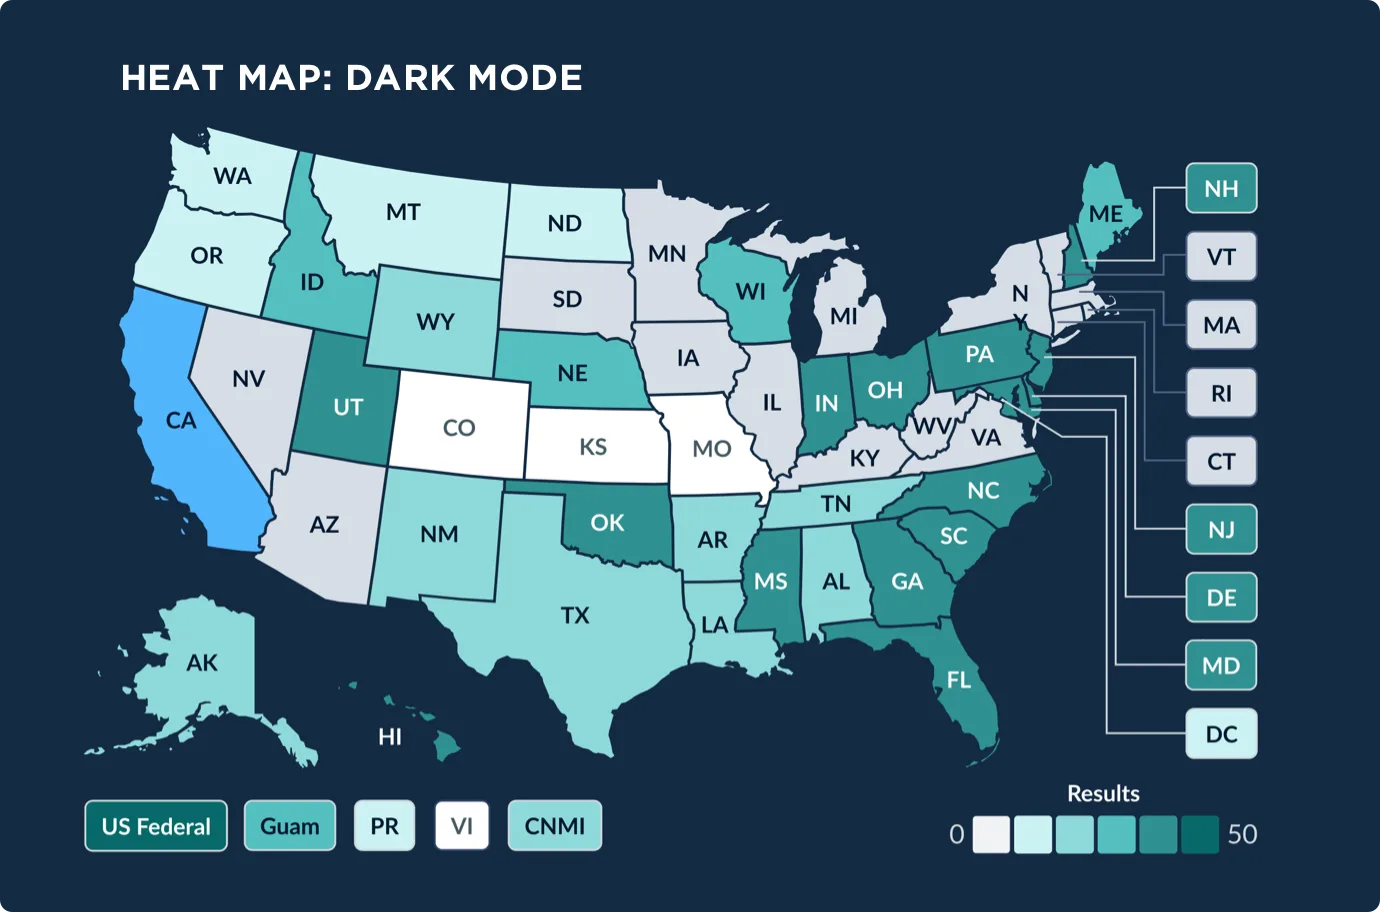
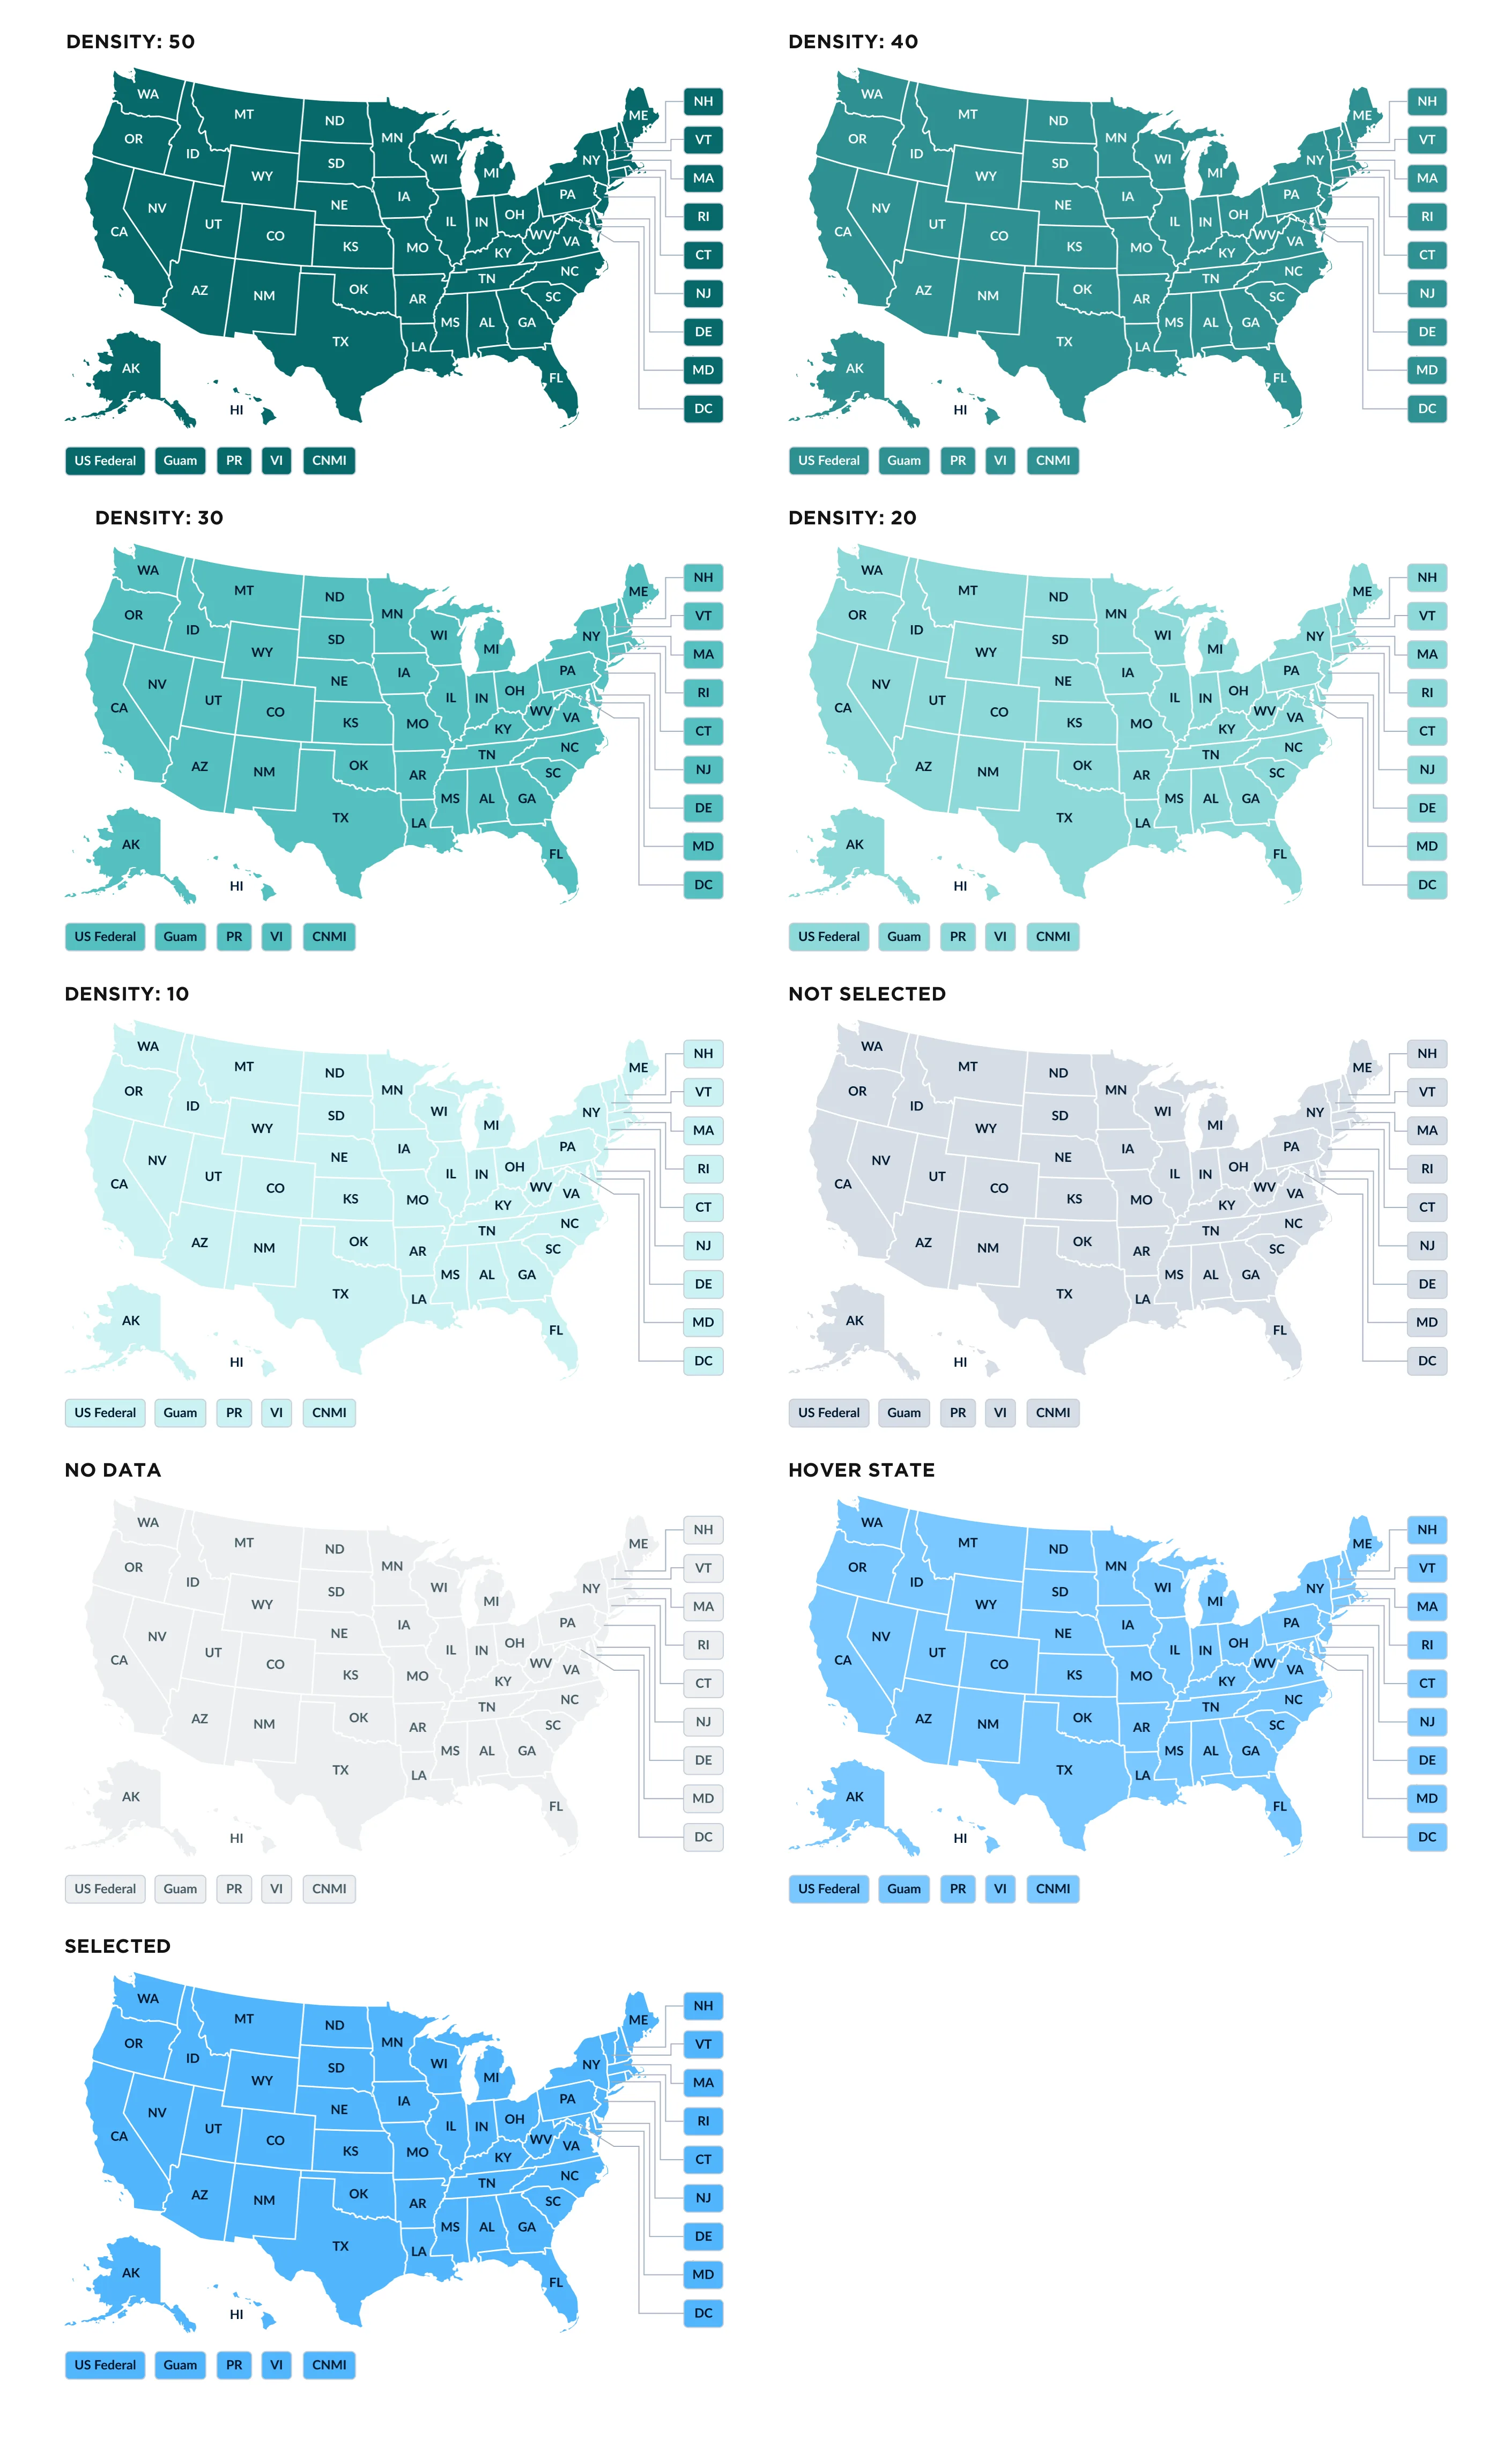
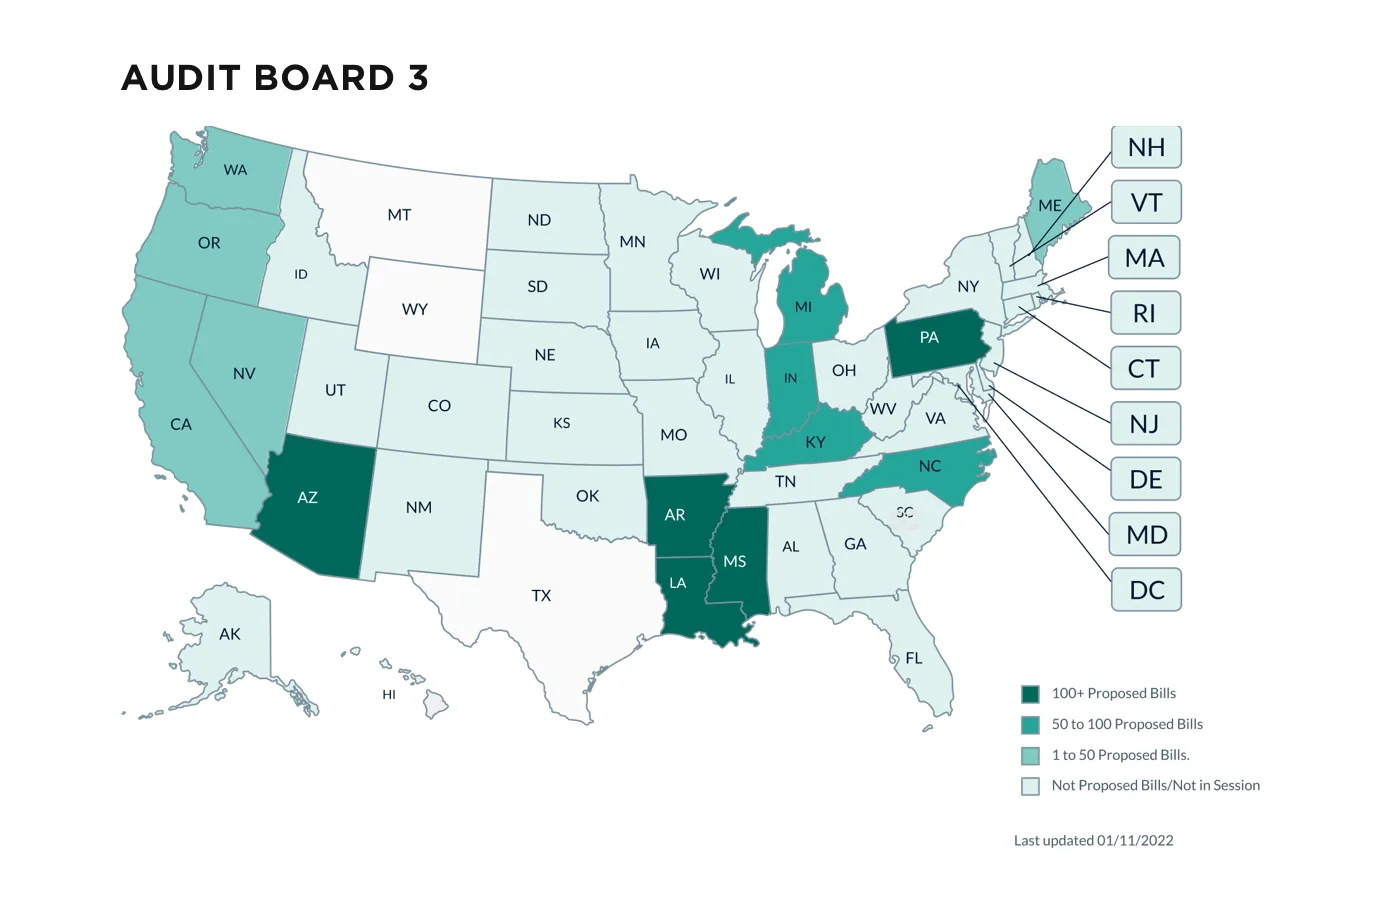
I designed the U.S. heat map with a five-step density scale and states for hover, selected, not selected and no data, in both light and dark mode.
Many of the charts created were integrated into primary law products and extended products used by thousands every day.
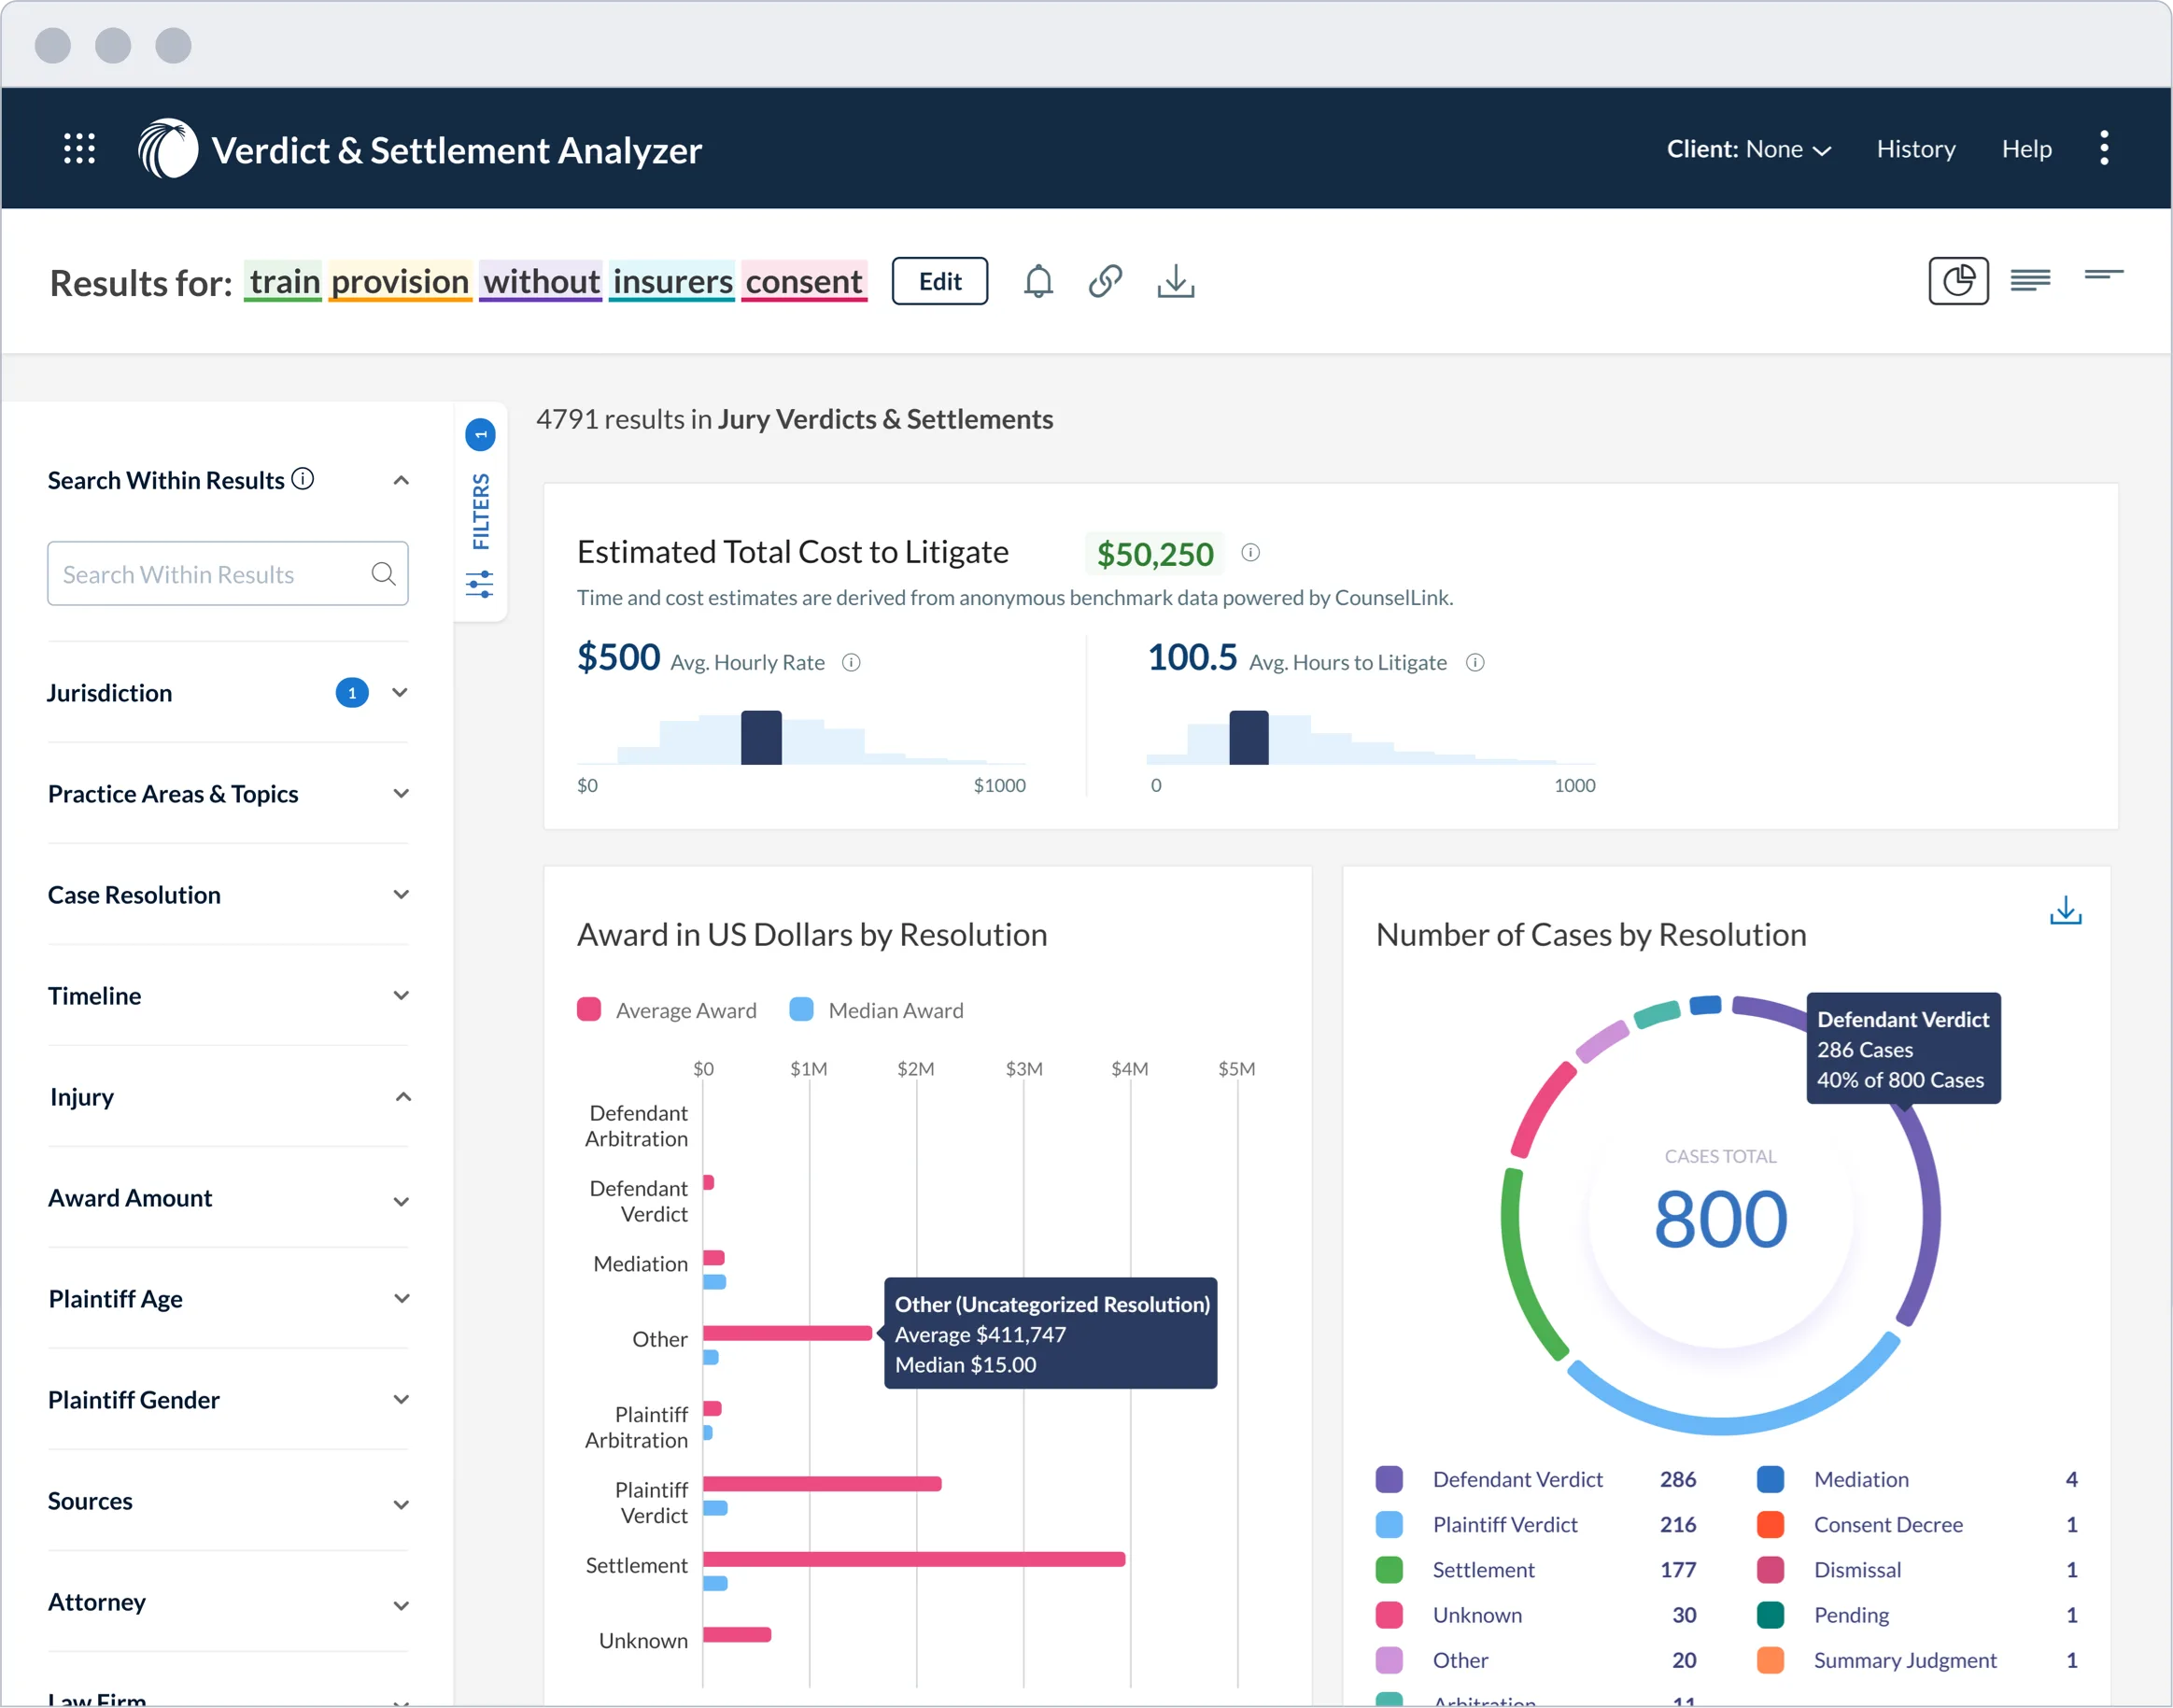
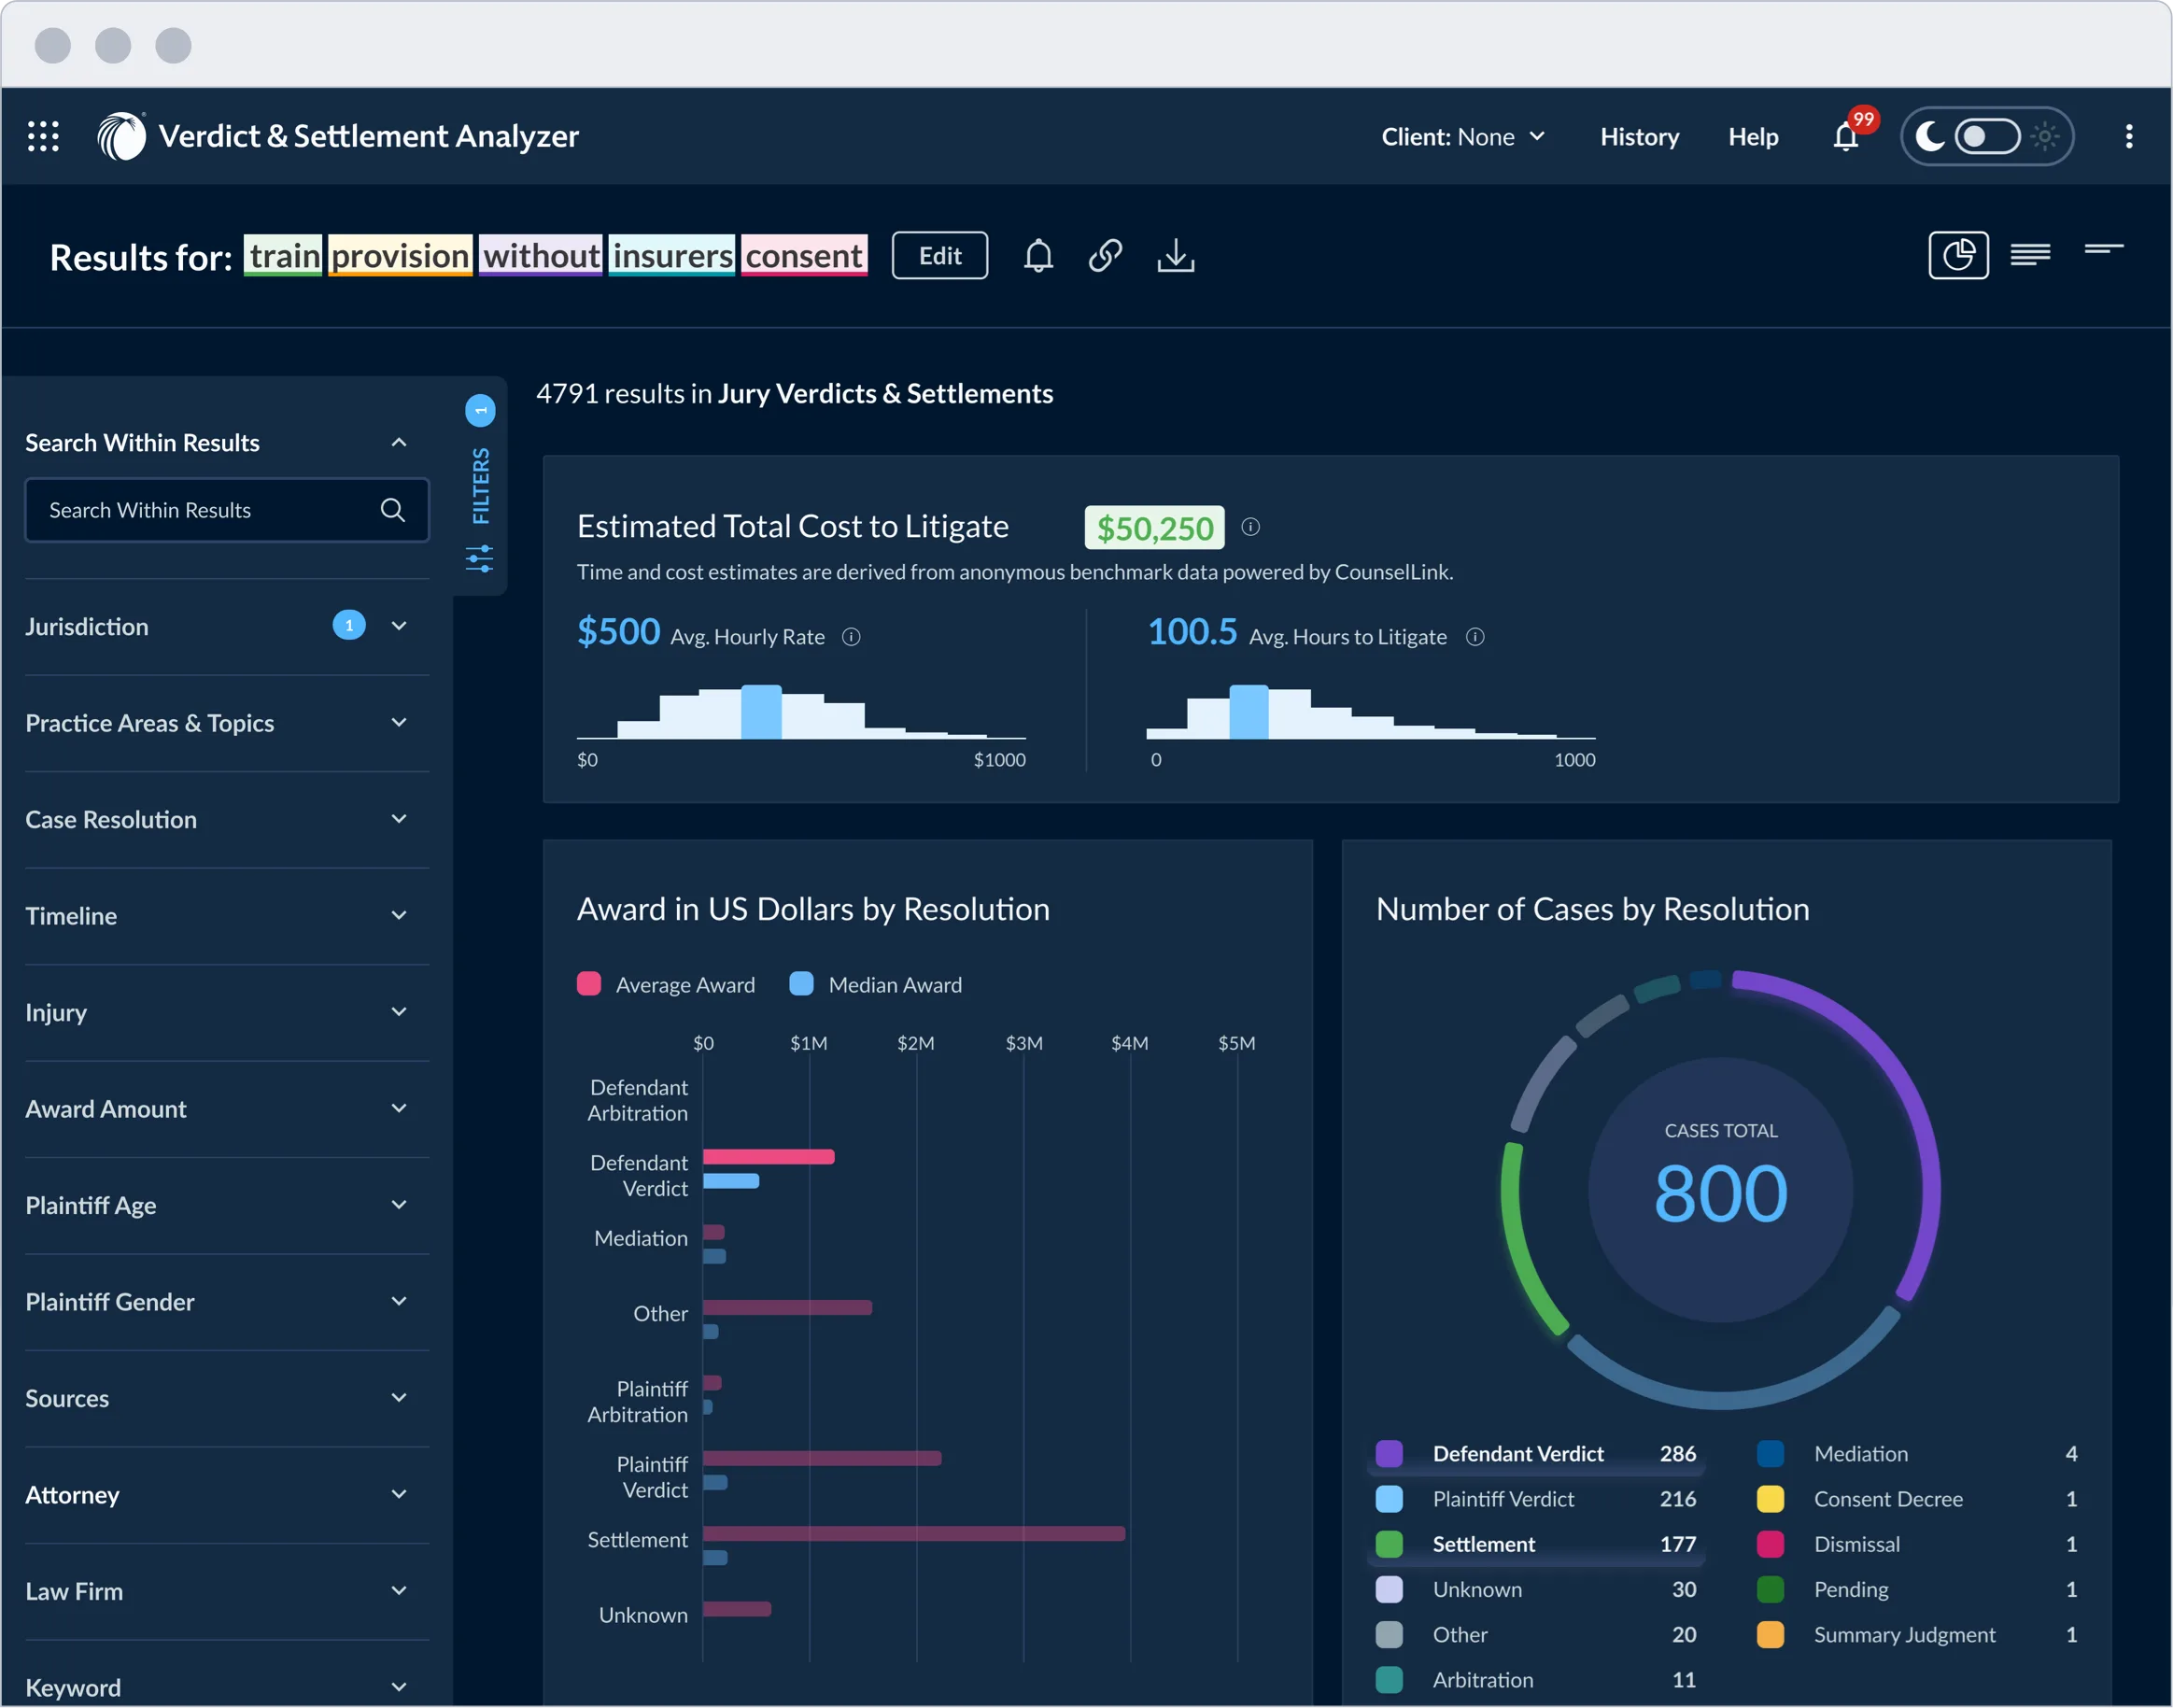
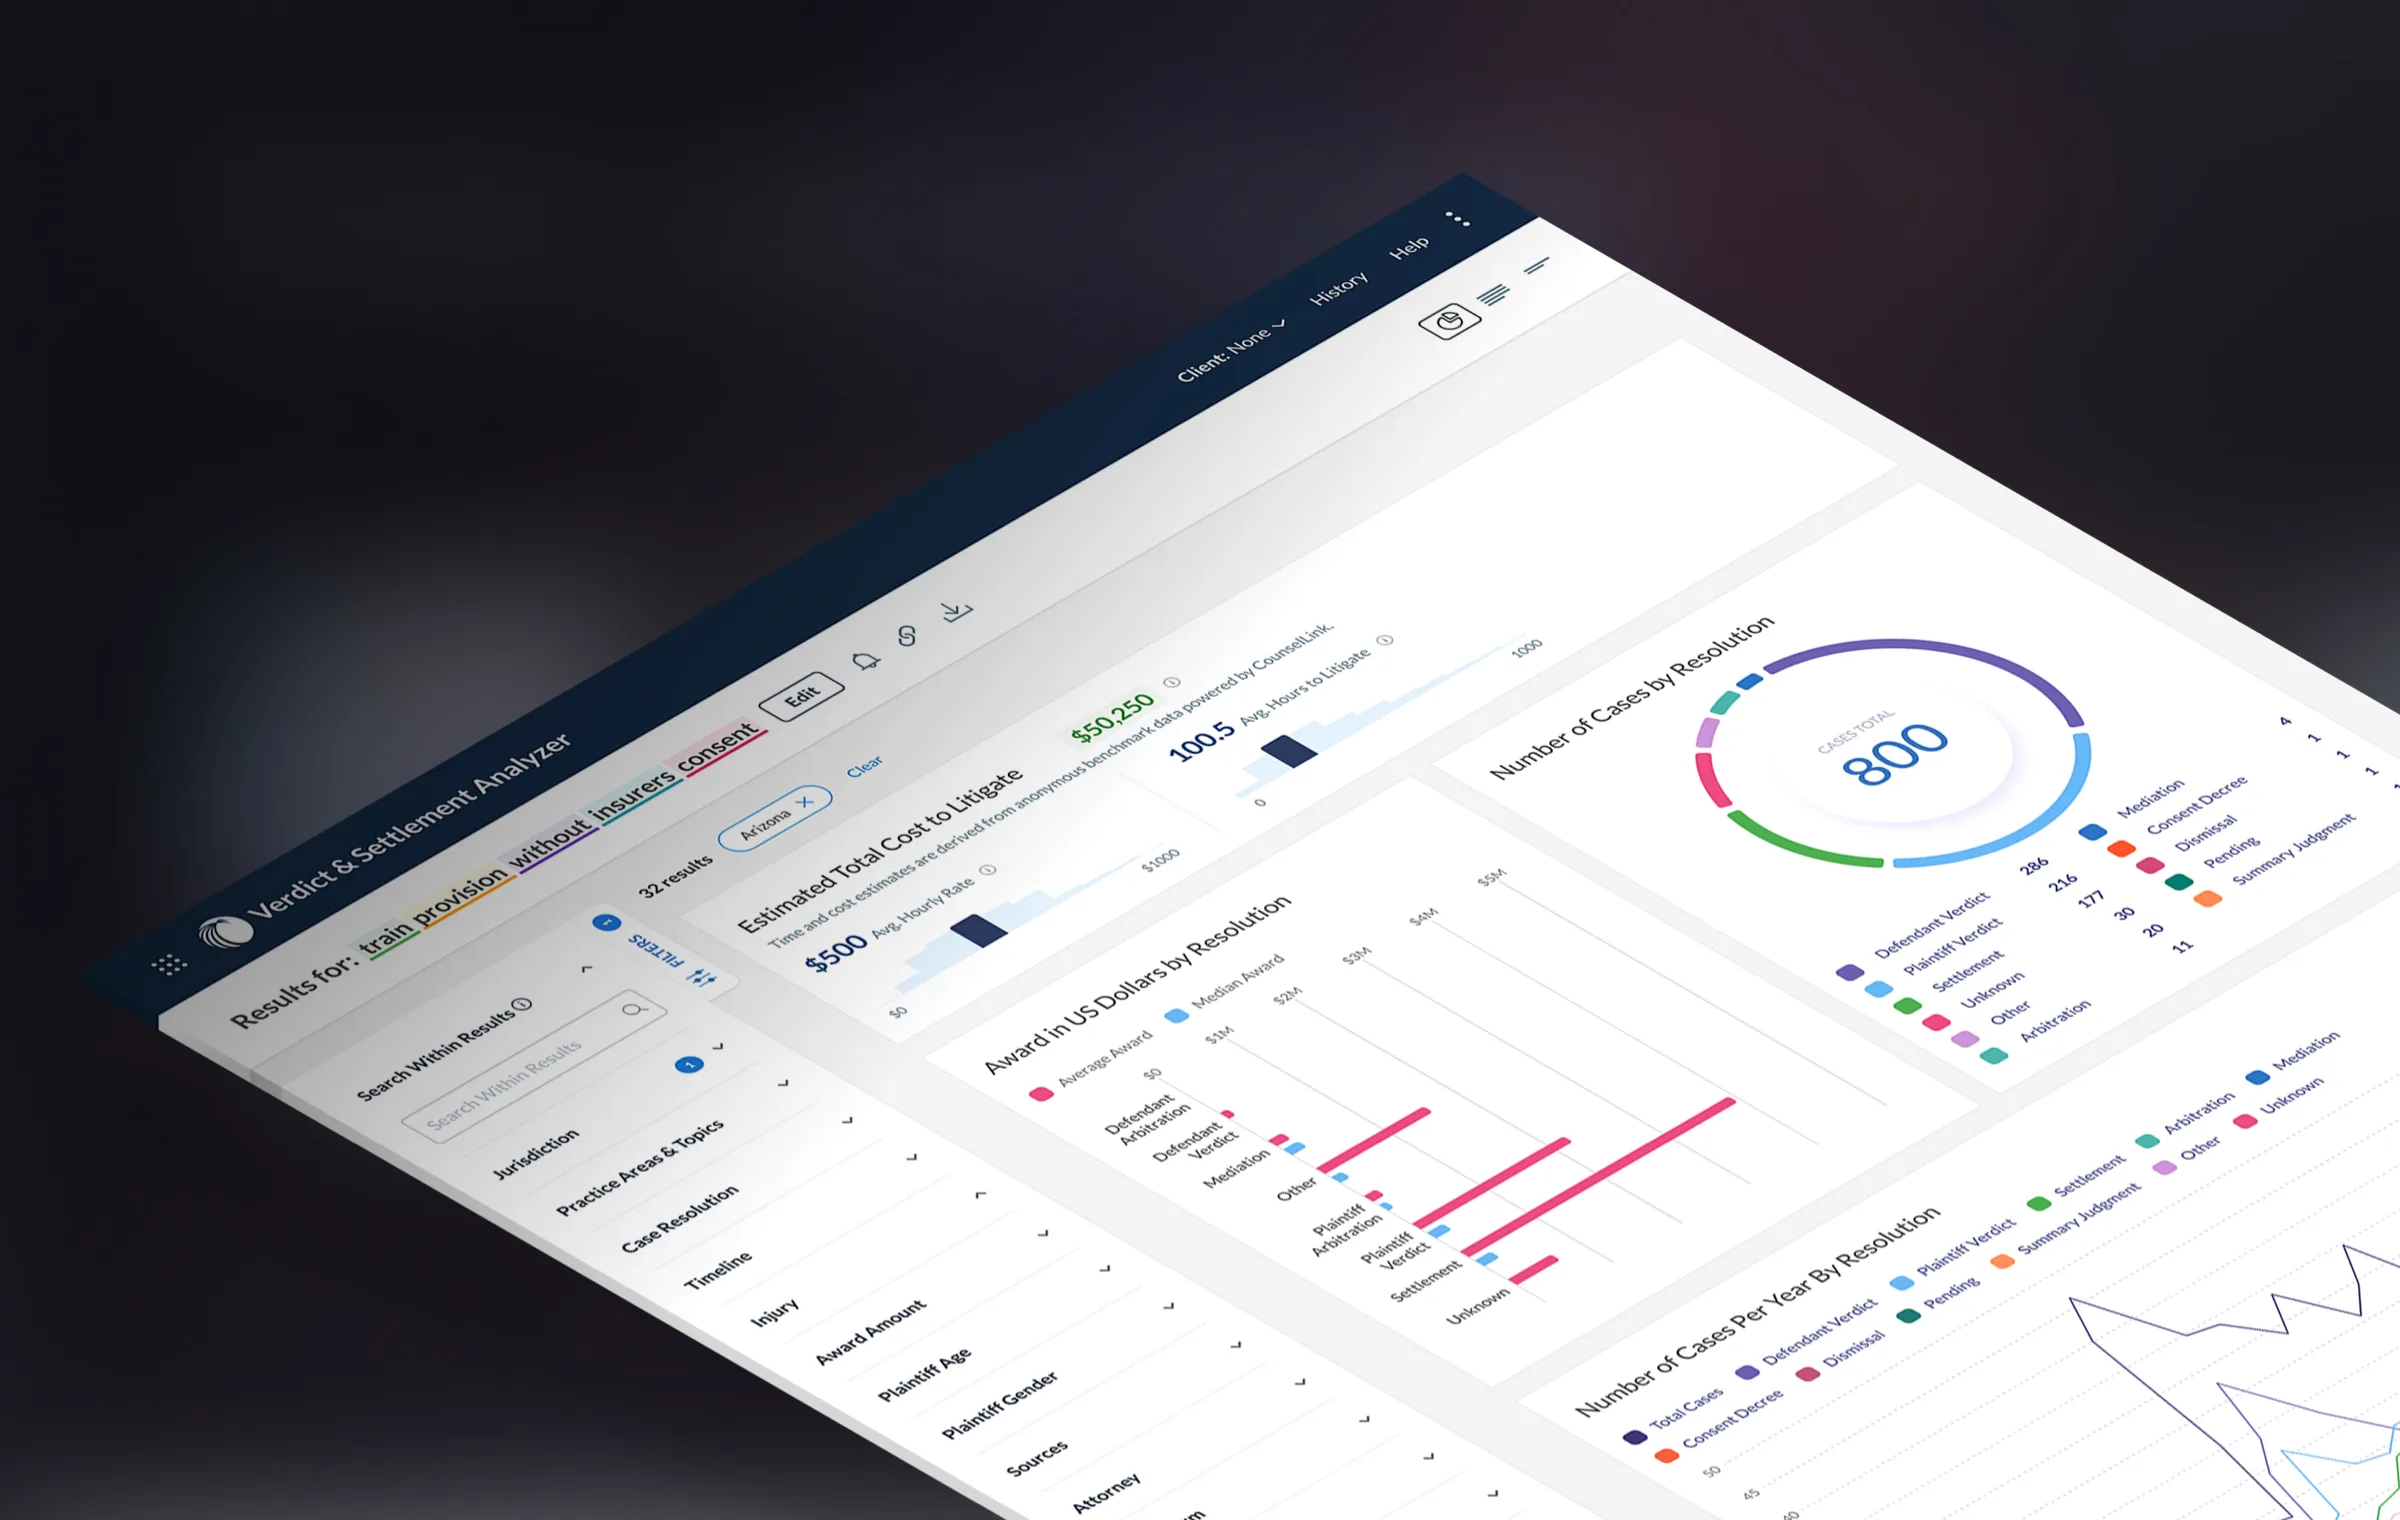
I applied the new chart system to the Verdict & Settlement Analyzer, a results page where customers explore jury verdicts and settlements. The cost histograms, awards bar chart and cases-by-resolution donut share one category palette, so each color keeps its meaning across every chart, in both light and dark mode.
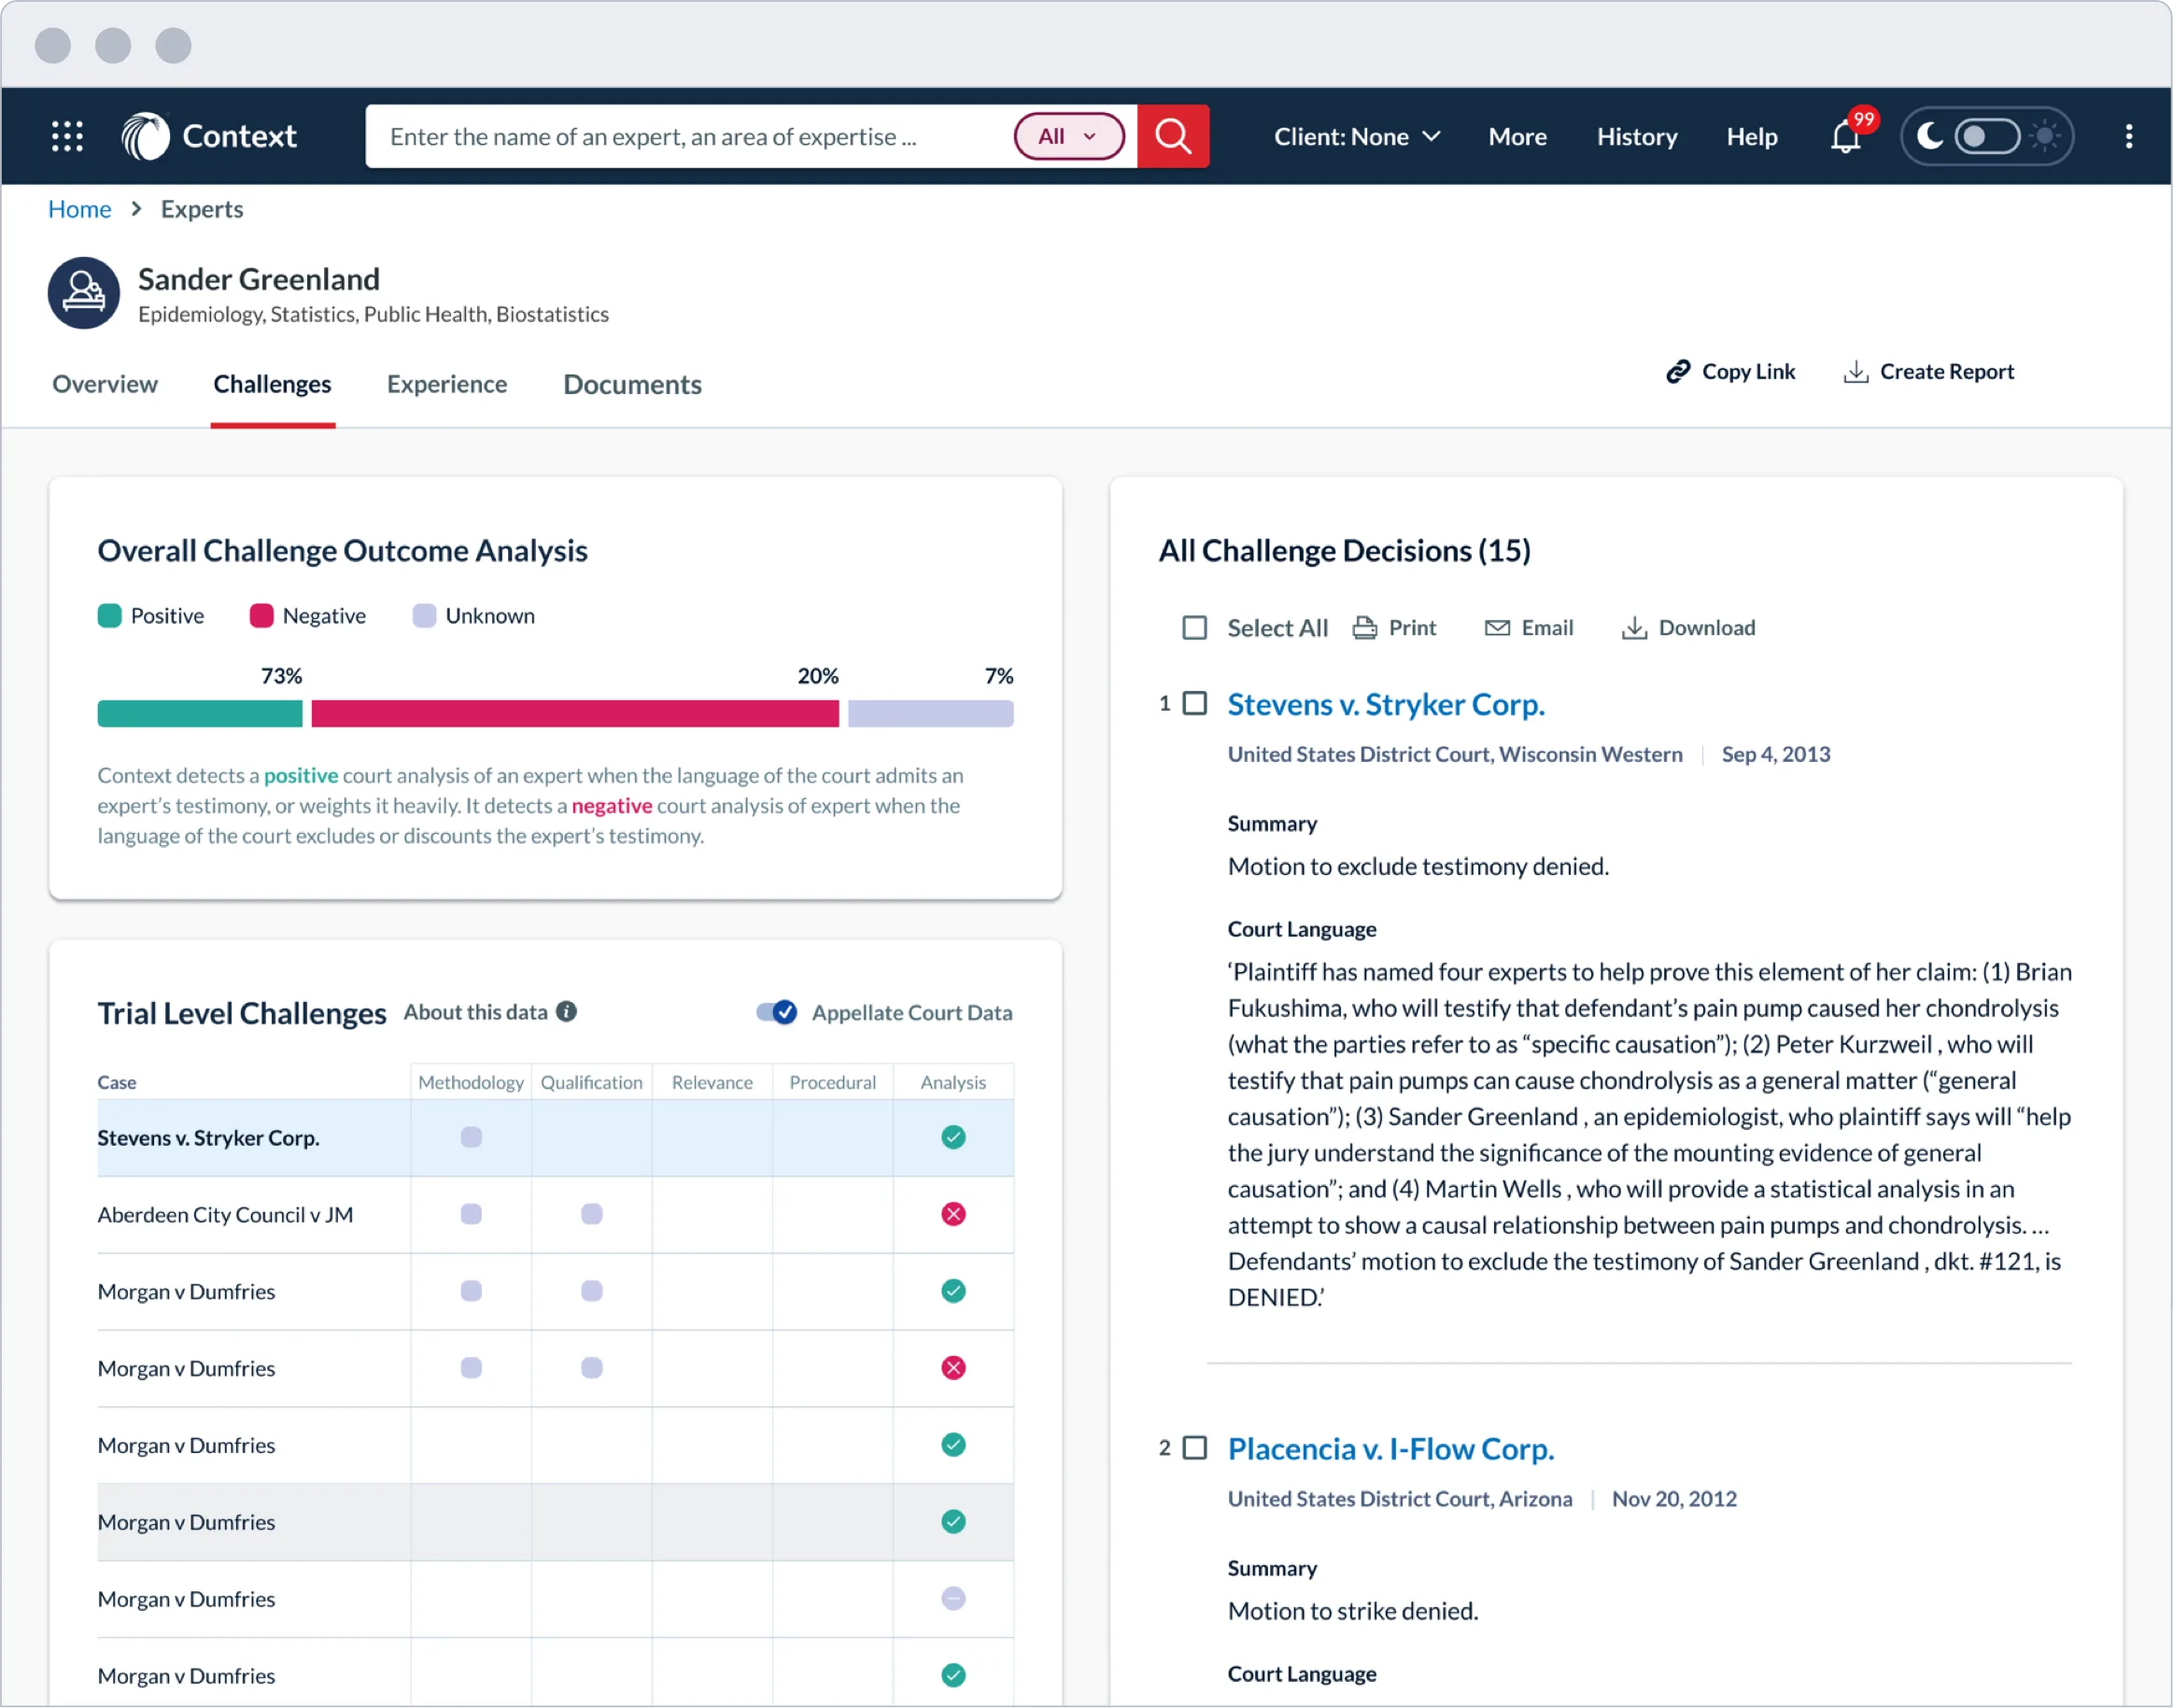
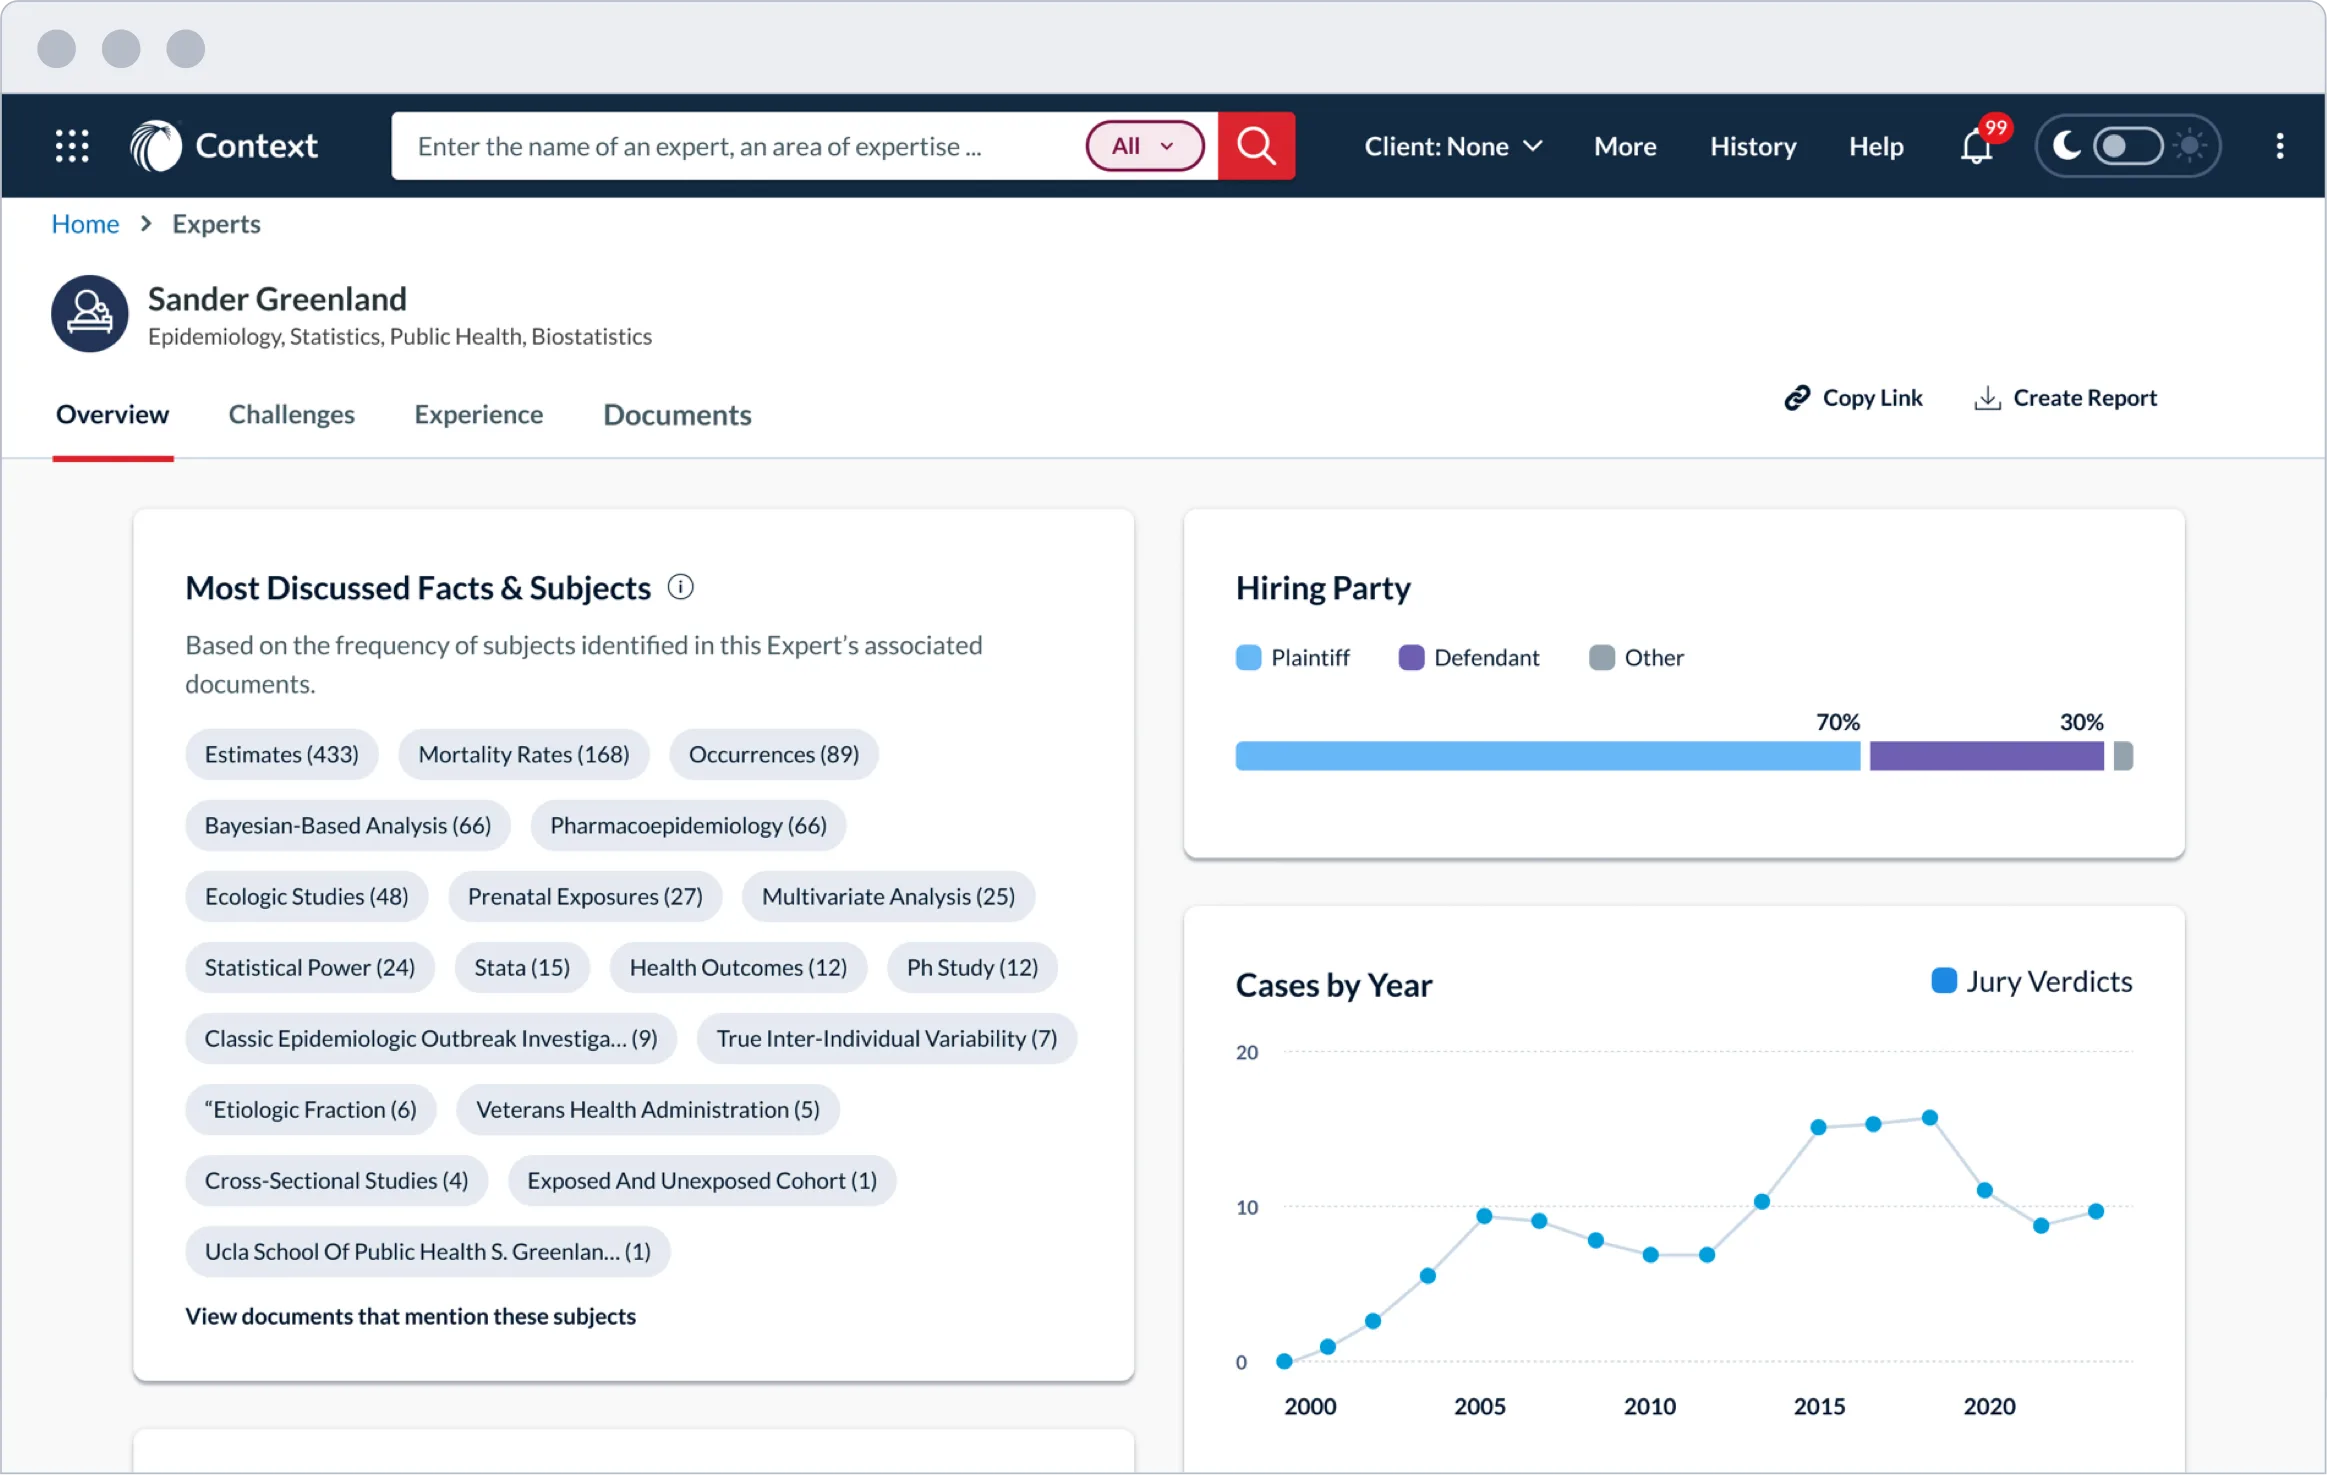
Shown below are other product scenarios that feature the newly created charts. Many of the new charts replaced the preexisting ones to harmonize them across all the products.

I worked through five steps, from collecting inspiration, color and graph auditing and experimentation to defining the final category colors.
Information and Inspiration Discovery
Color Identification and Graph Audit
Identifying Color Problems and Solutions
Visual Material Color Palette Alignments
Categories for Colors, Light and Dark
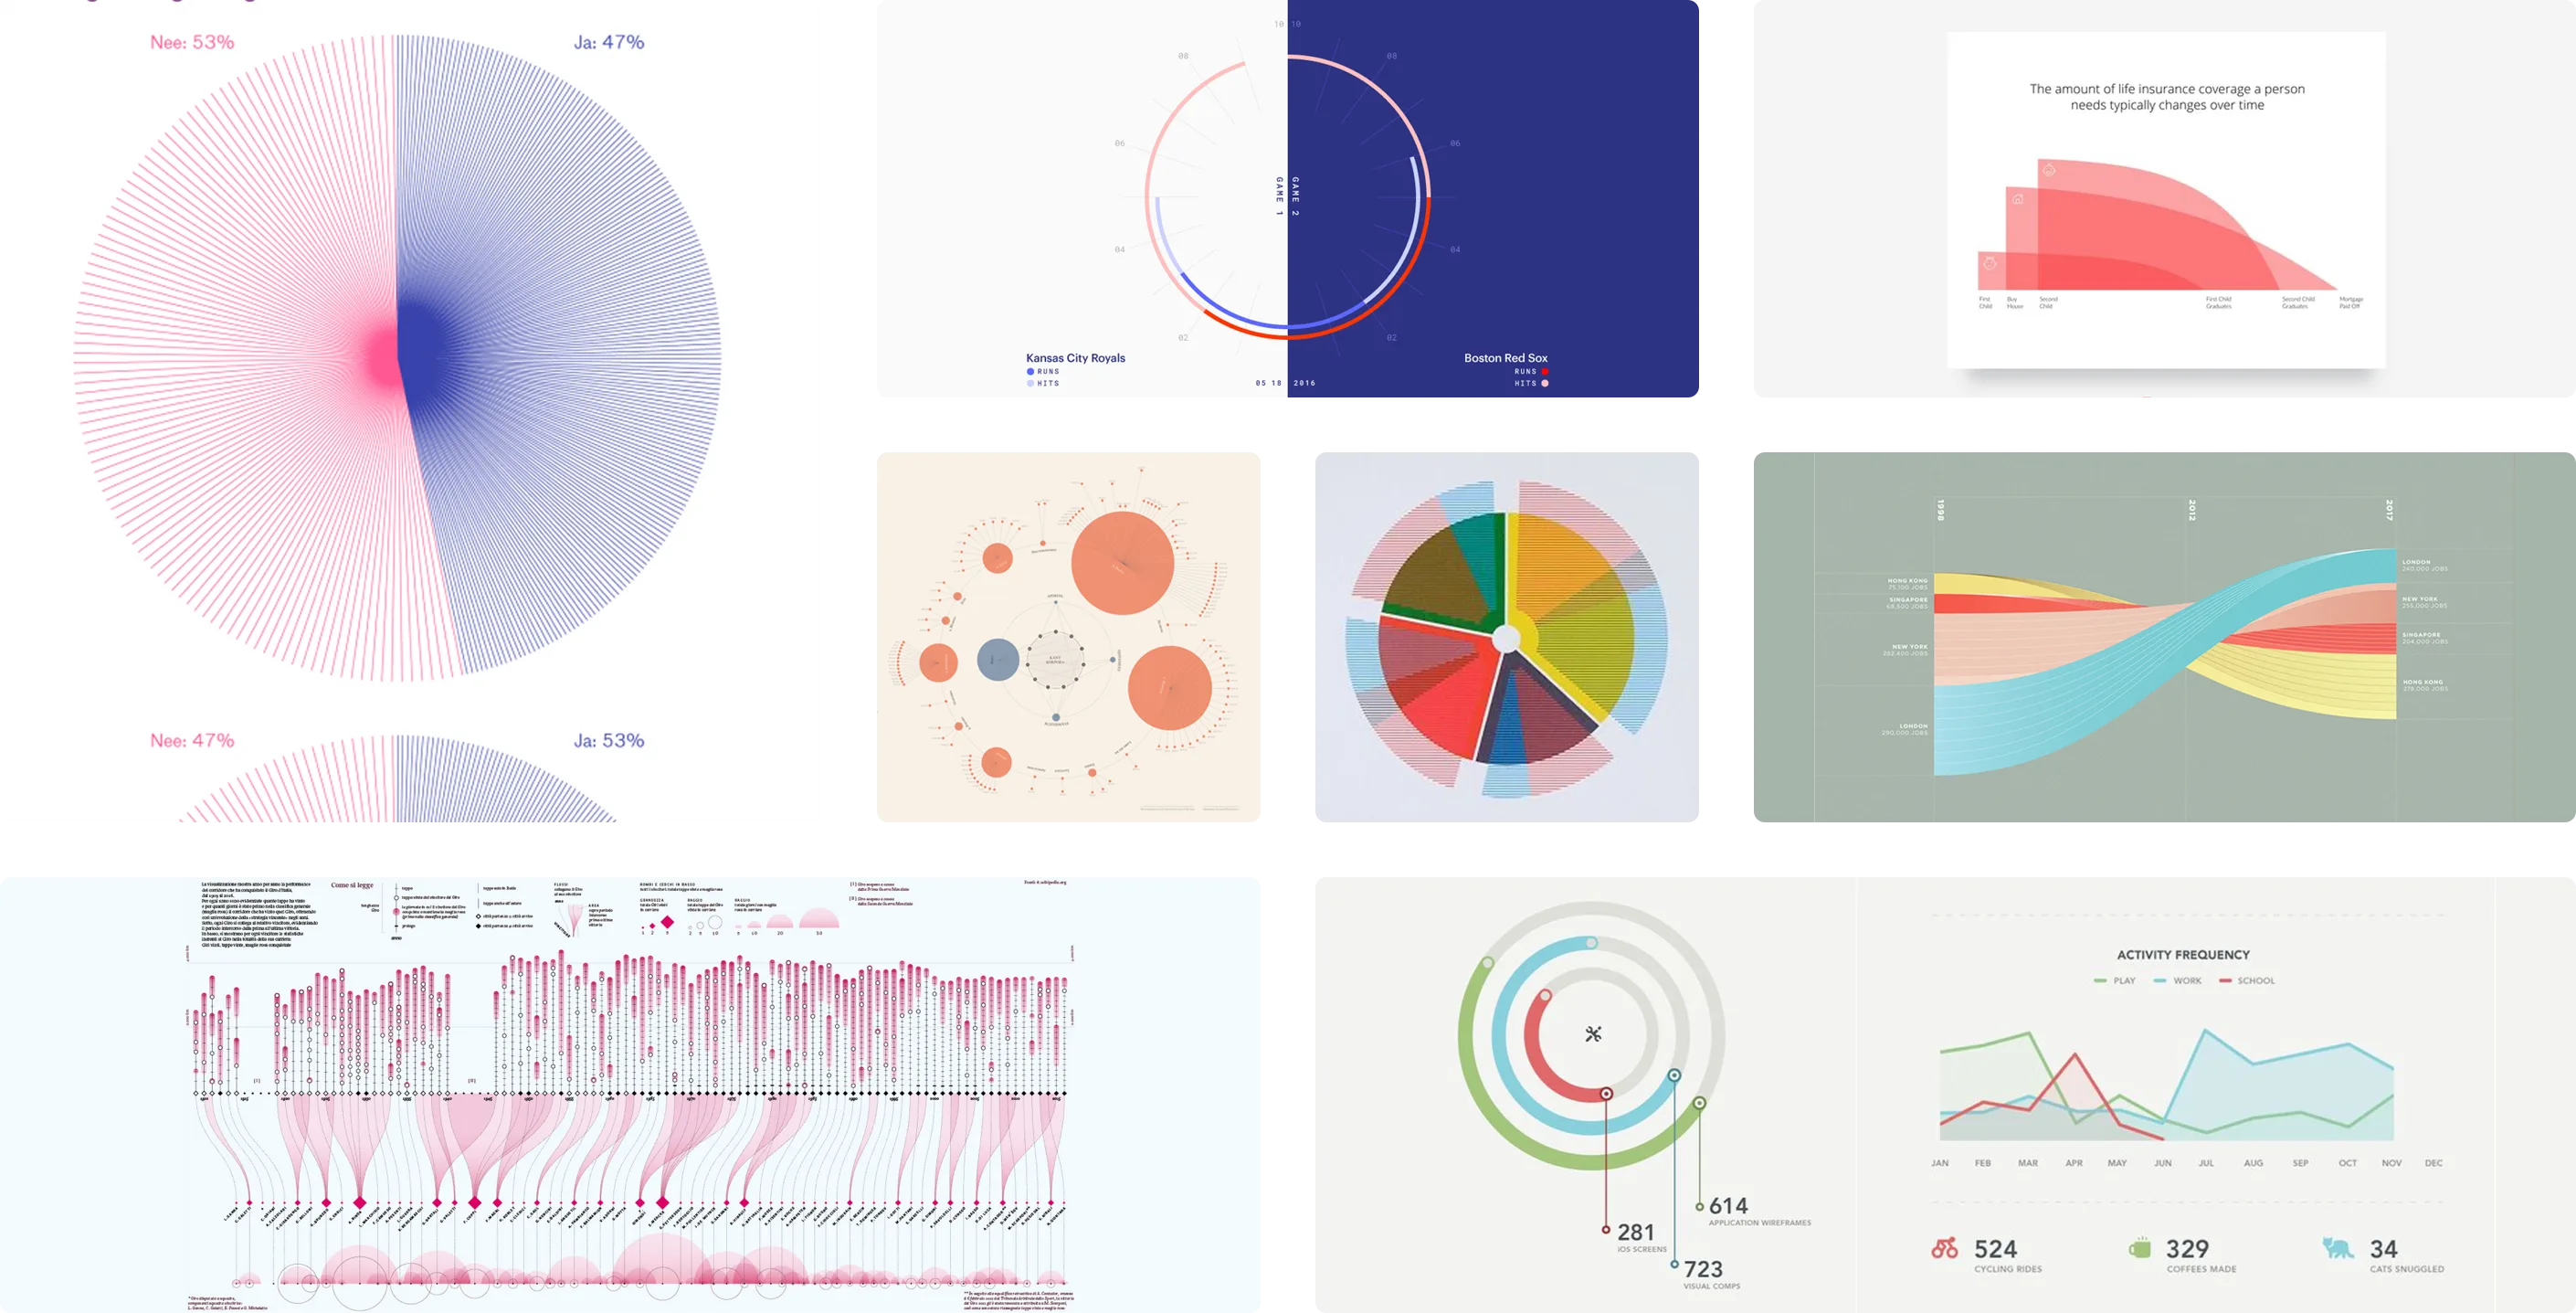
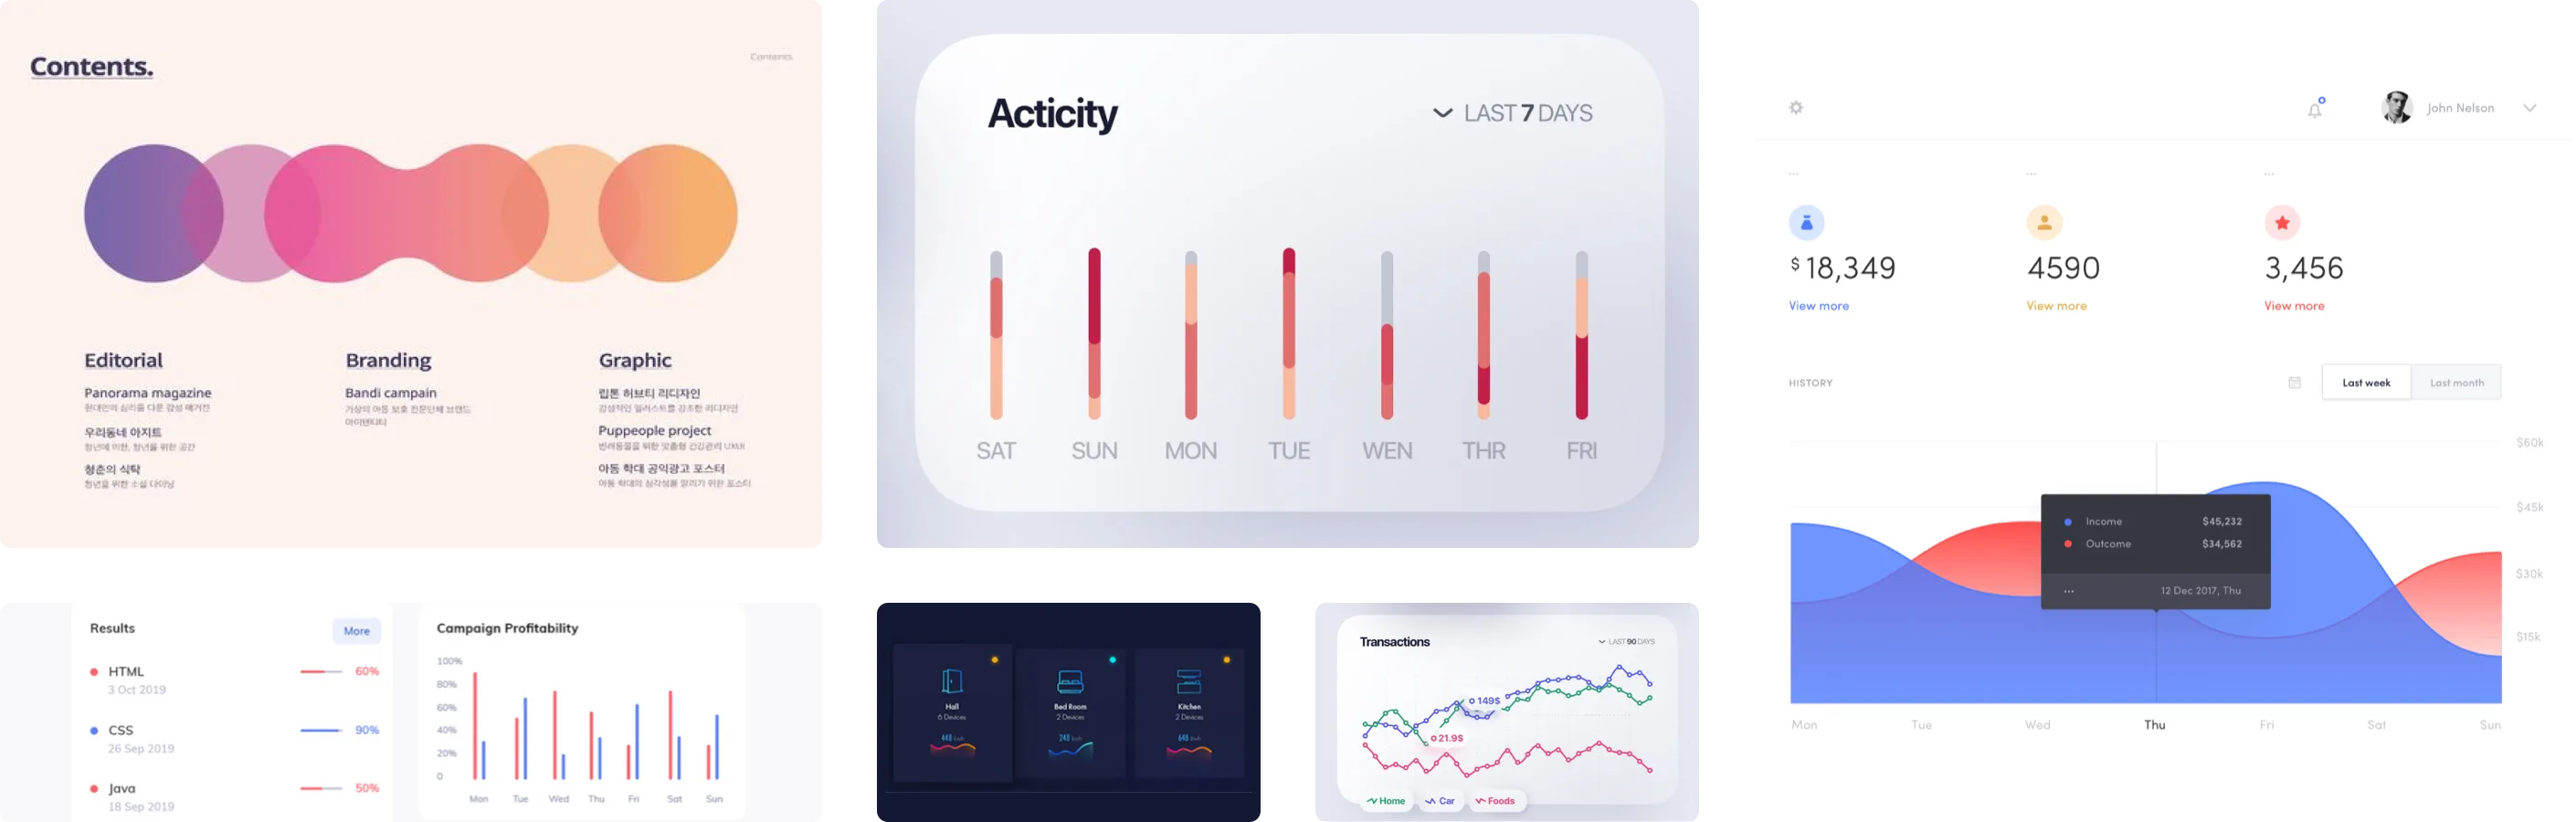
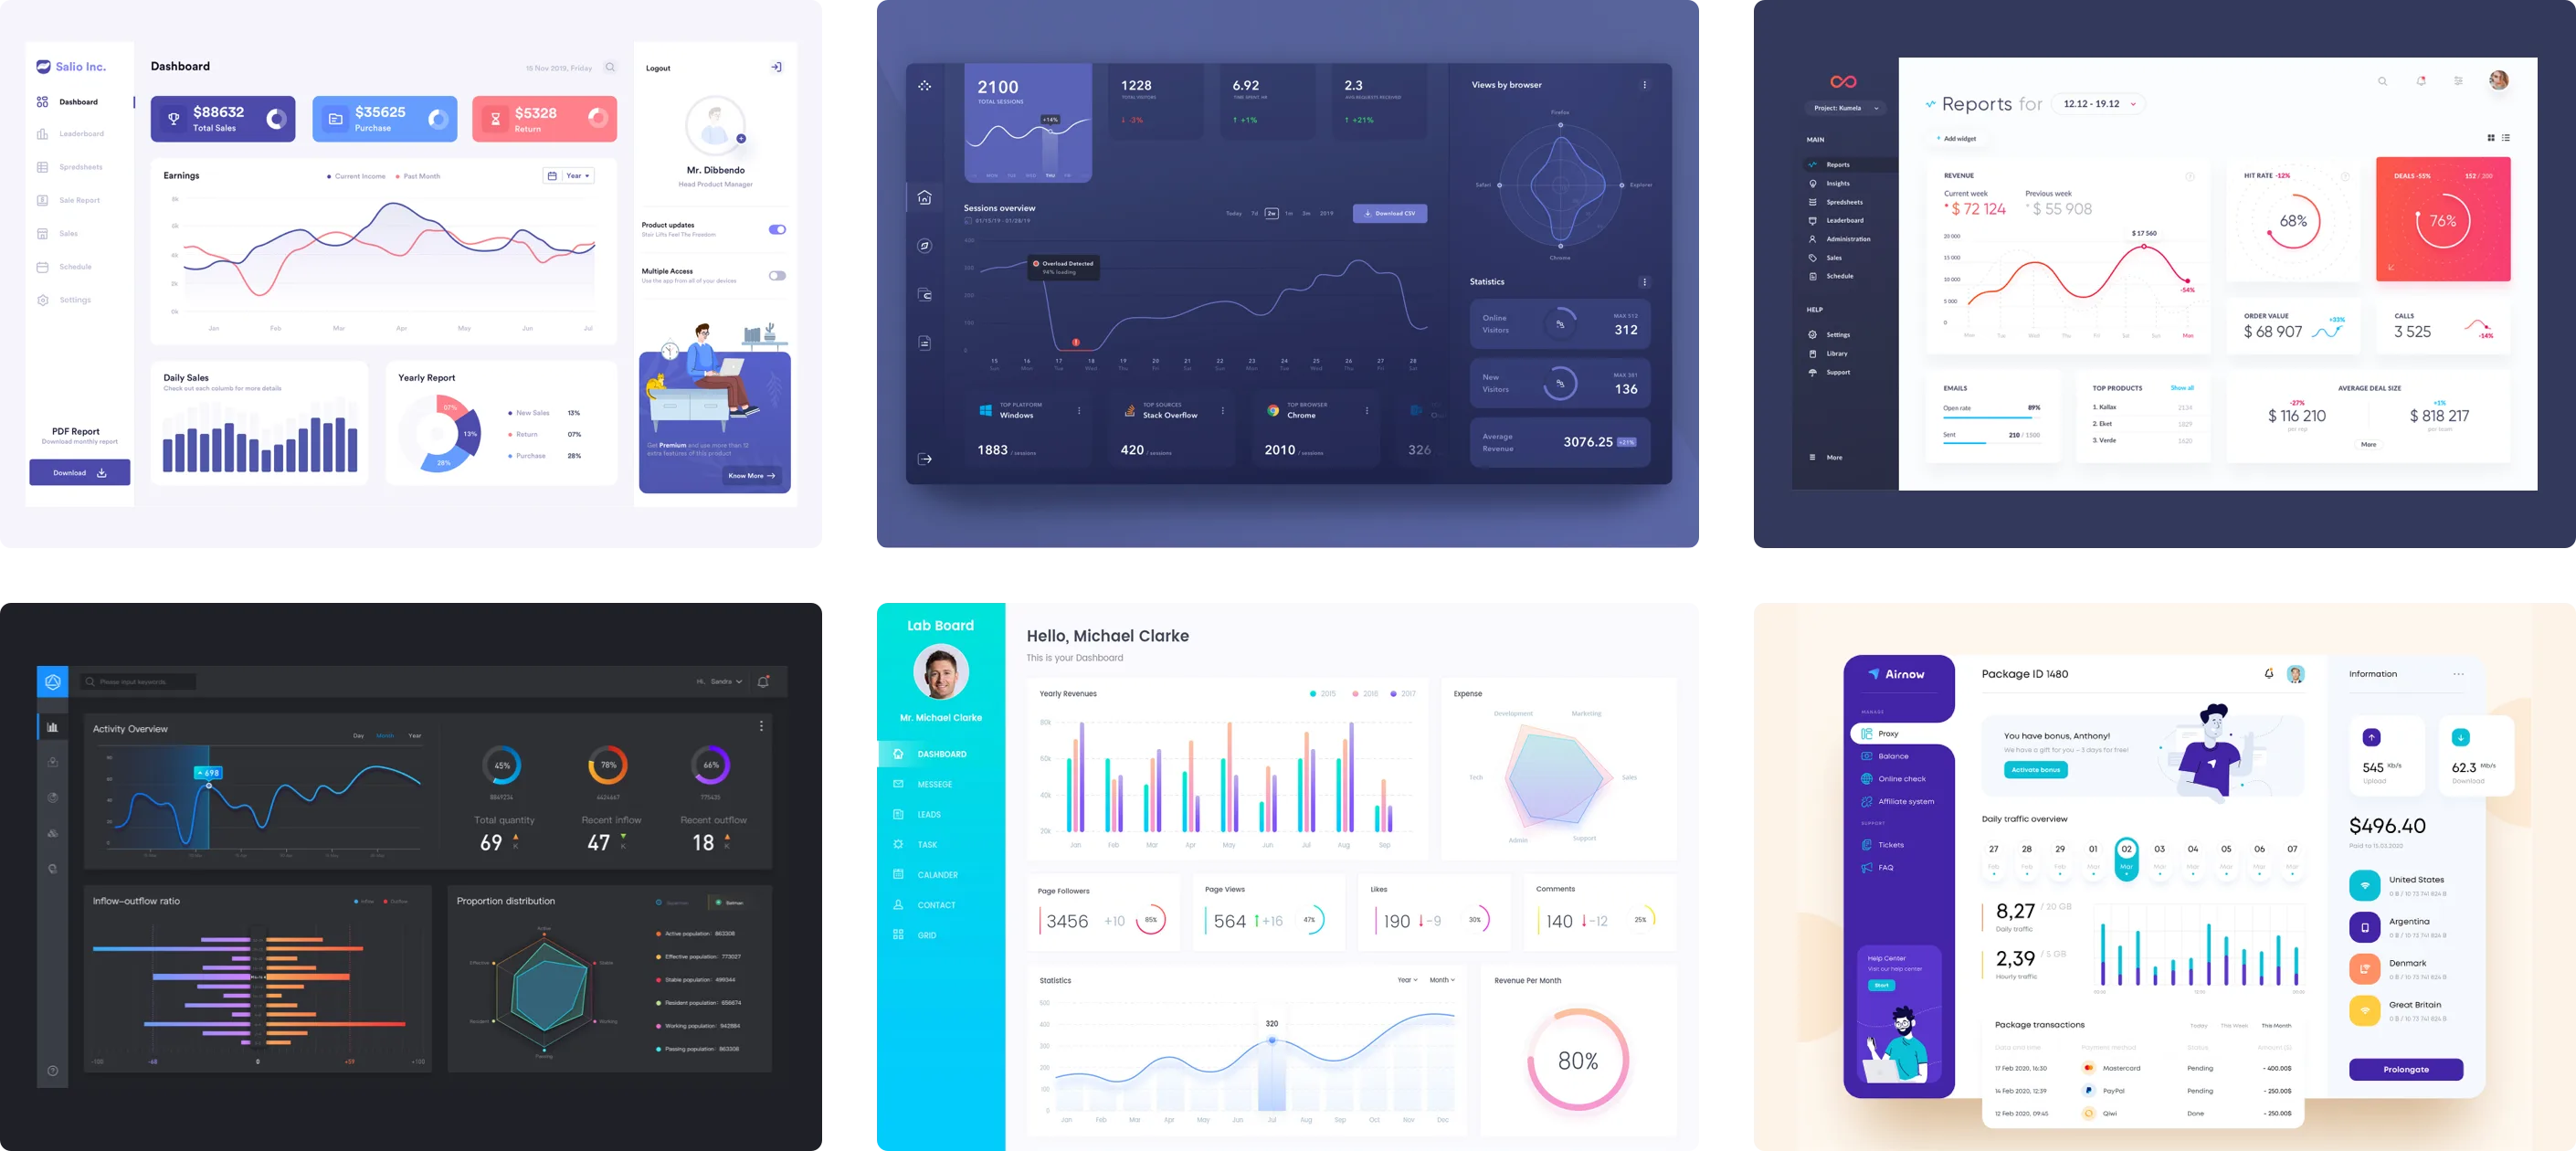
I explored various online sources for inspiration to better understand visual data trends and practicality of how data realistically appears in products and dashboard interfaces. I gathered ideas from print, digital, and dashboards.
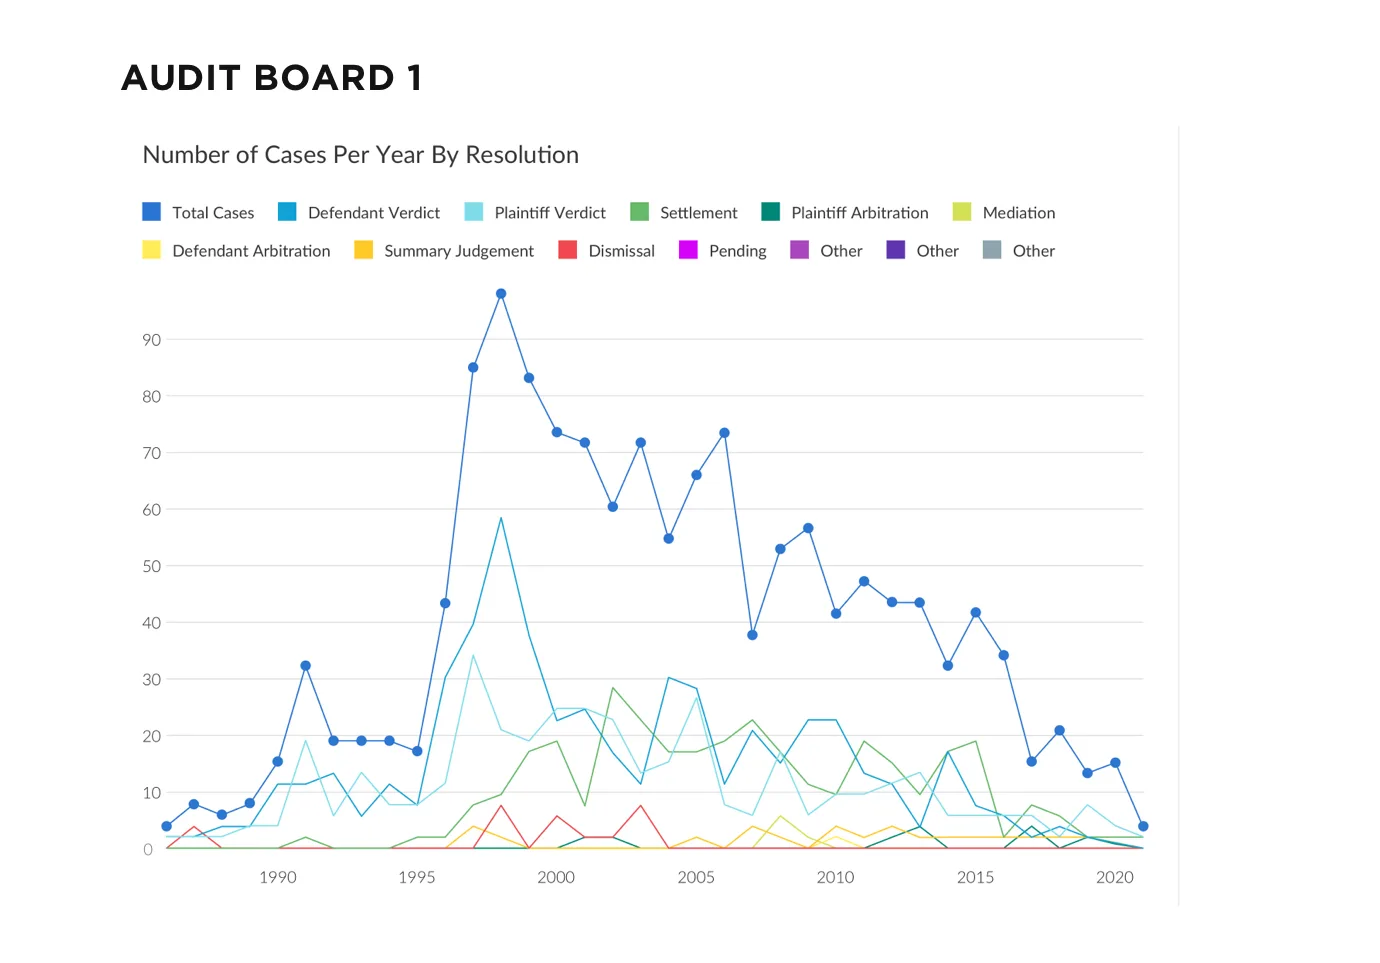
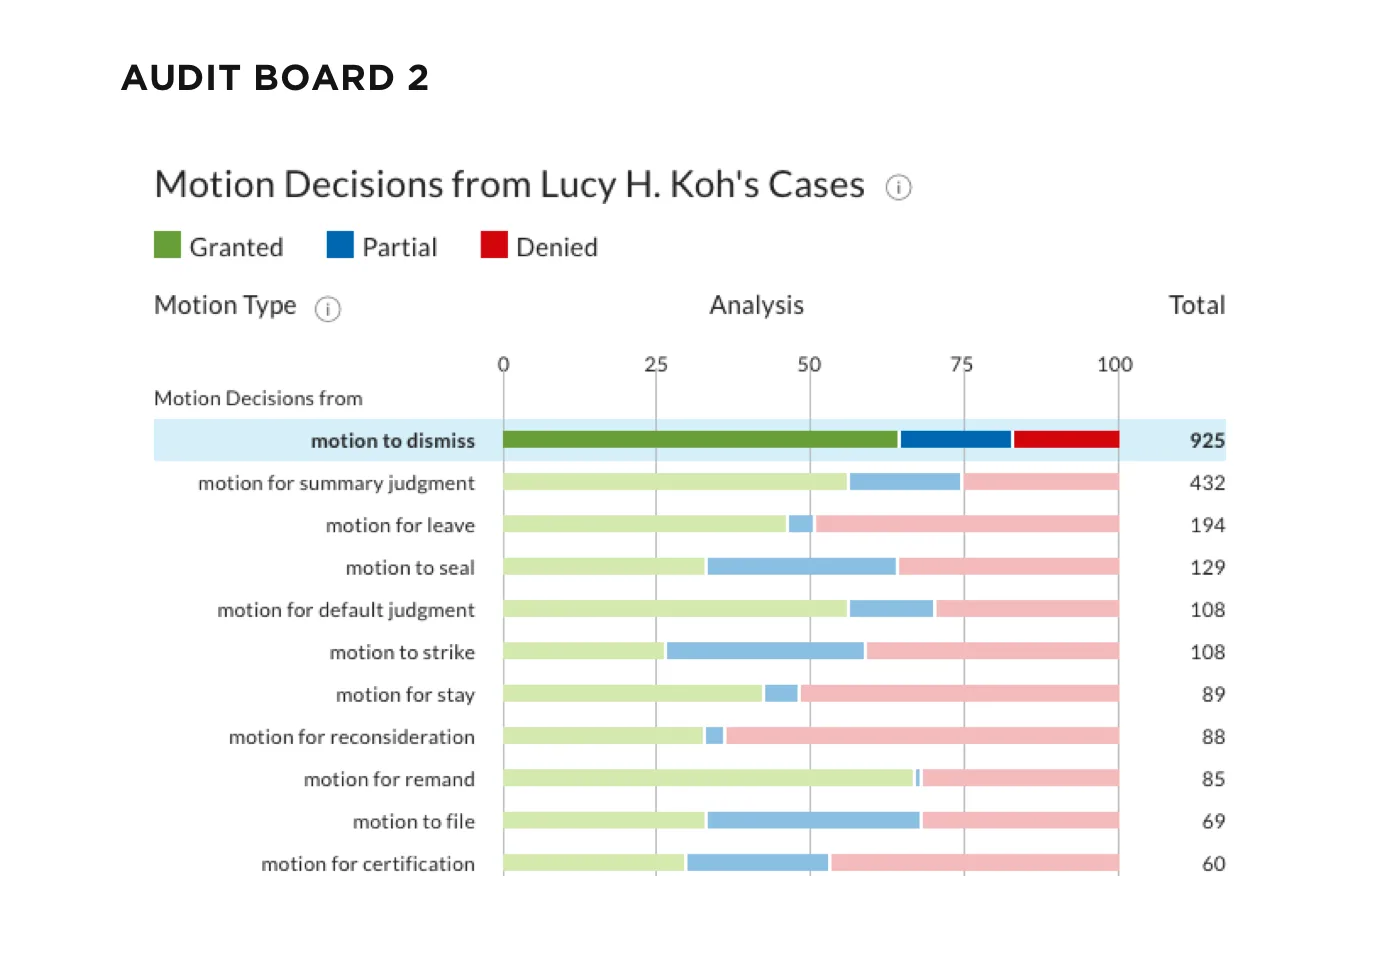
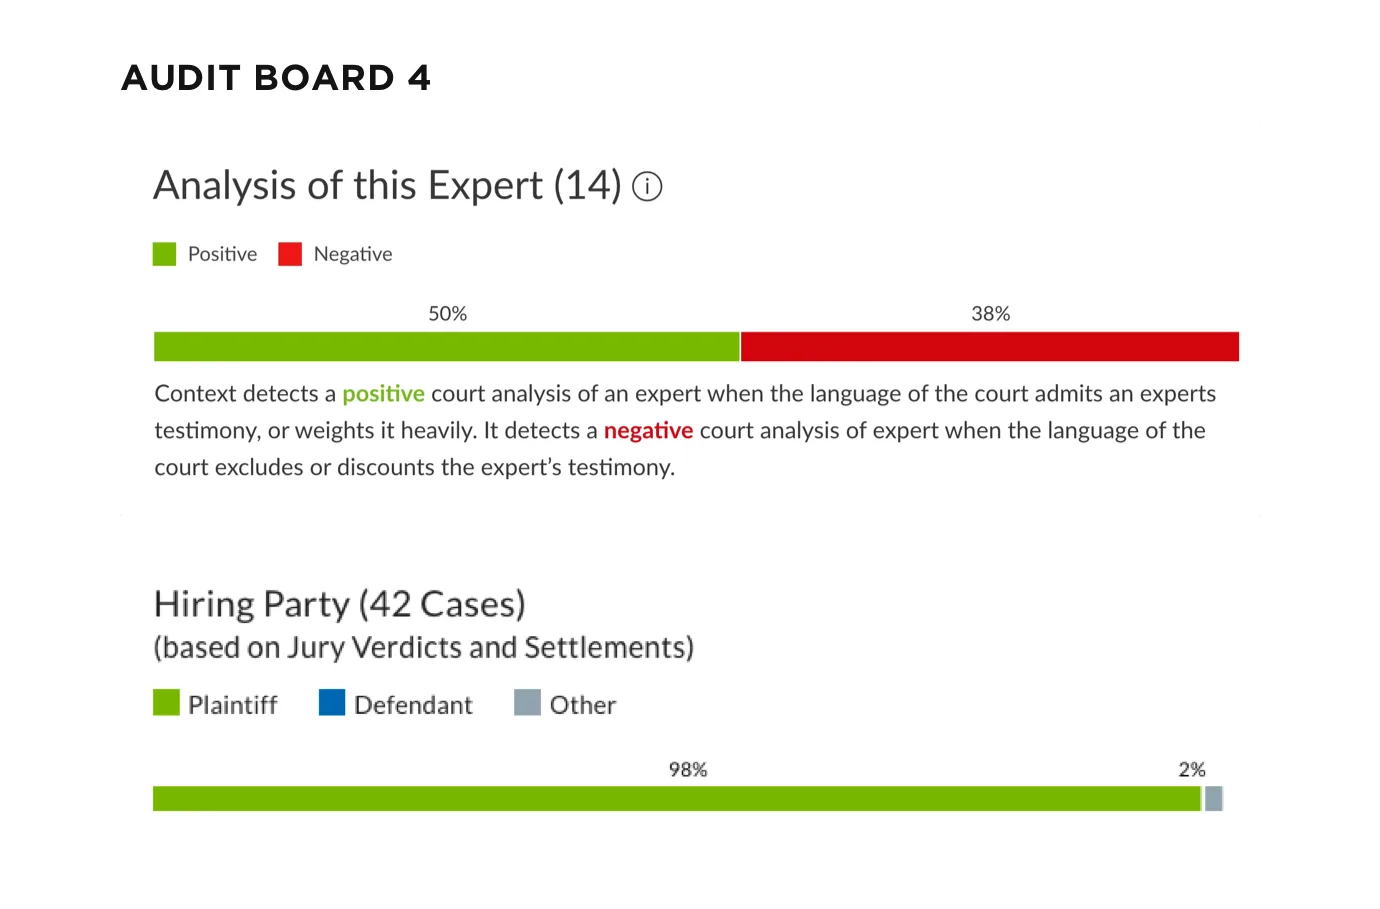
Before choosing any colors, I audited the charts in Context, a legal research product, to see how they were built and where they fell short.
1. Bar Charts: Each bar chart shares a similar thickness and style.
2. Line Charts: The line stroke on the line charts shared a similar thickness.
3. Chart Colors: Some of the charts share similar categories.
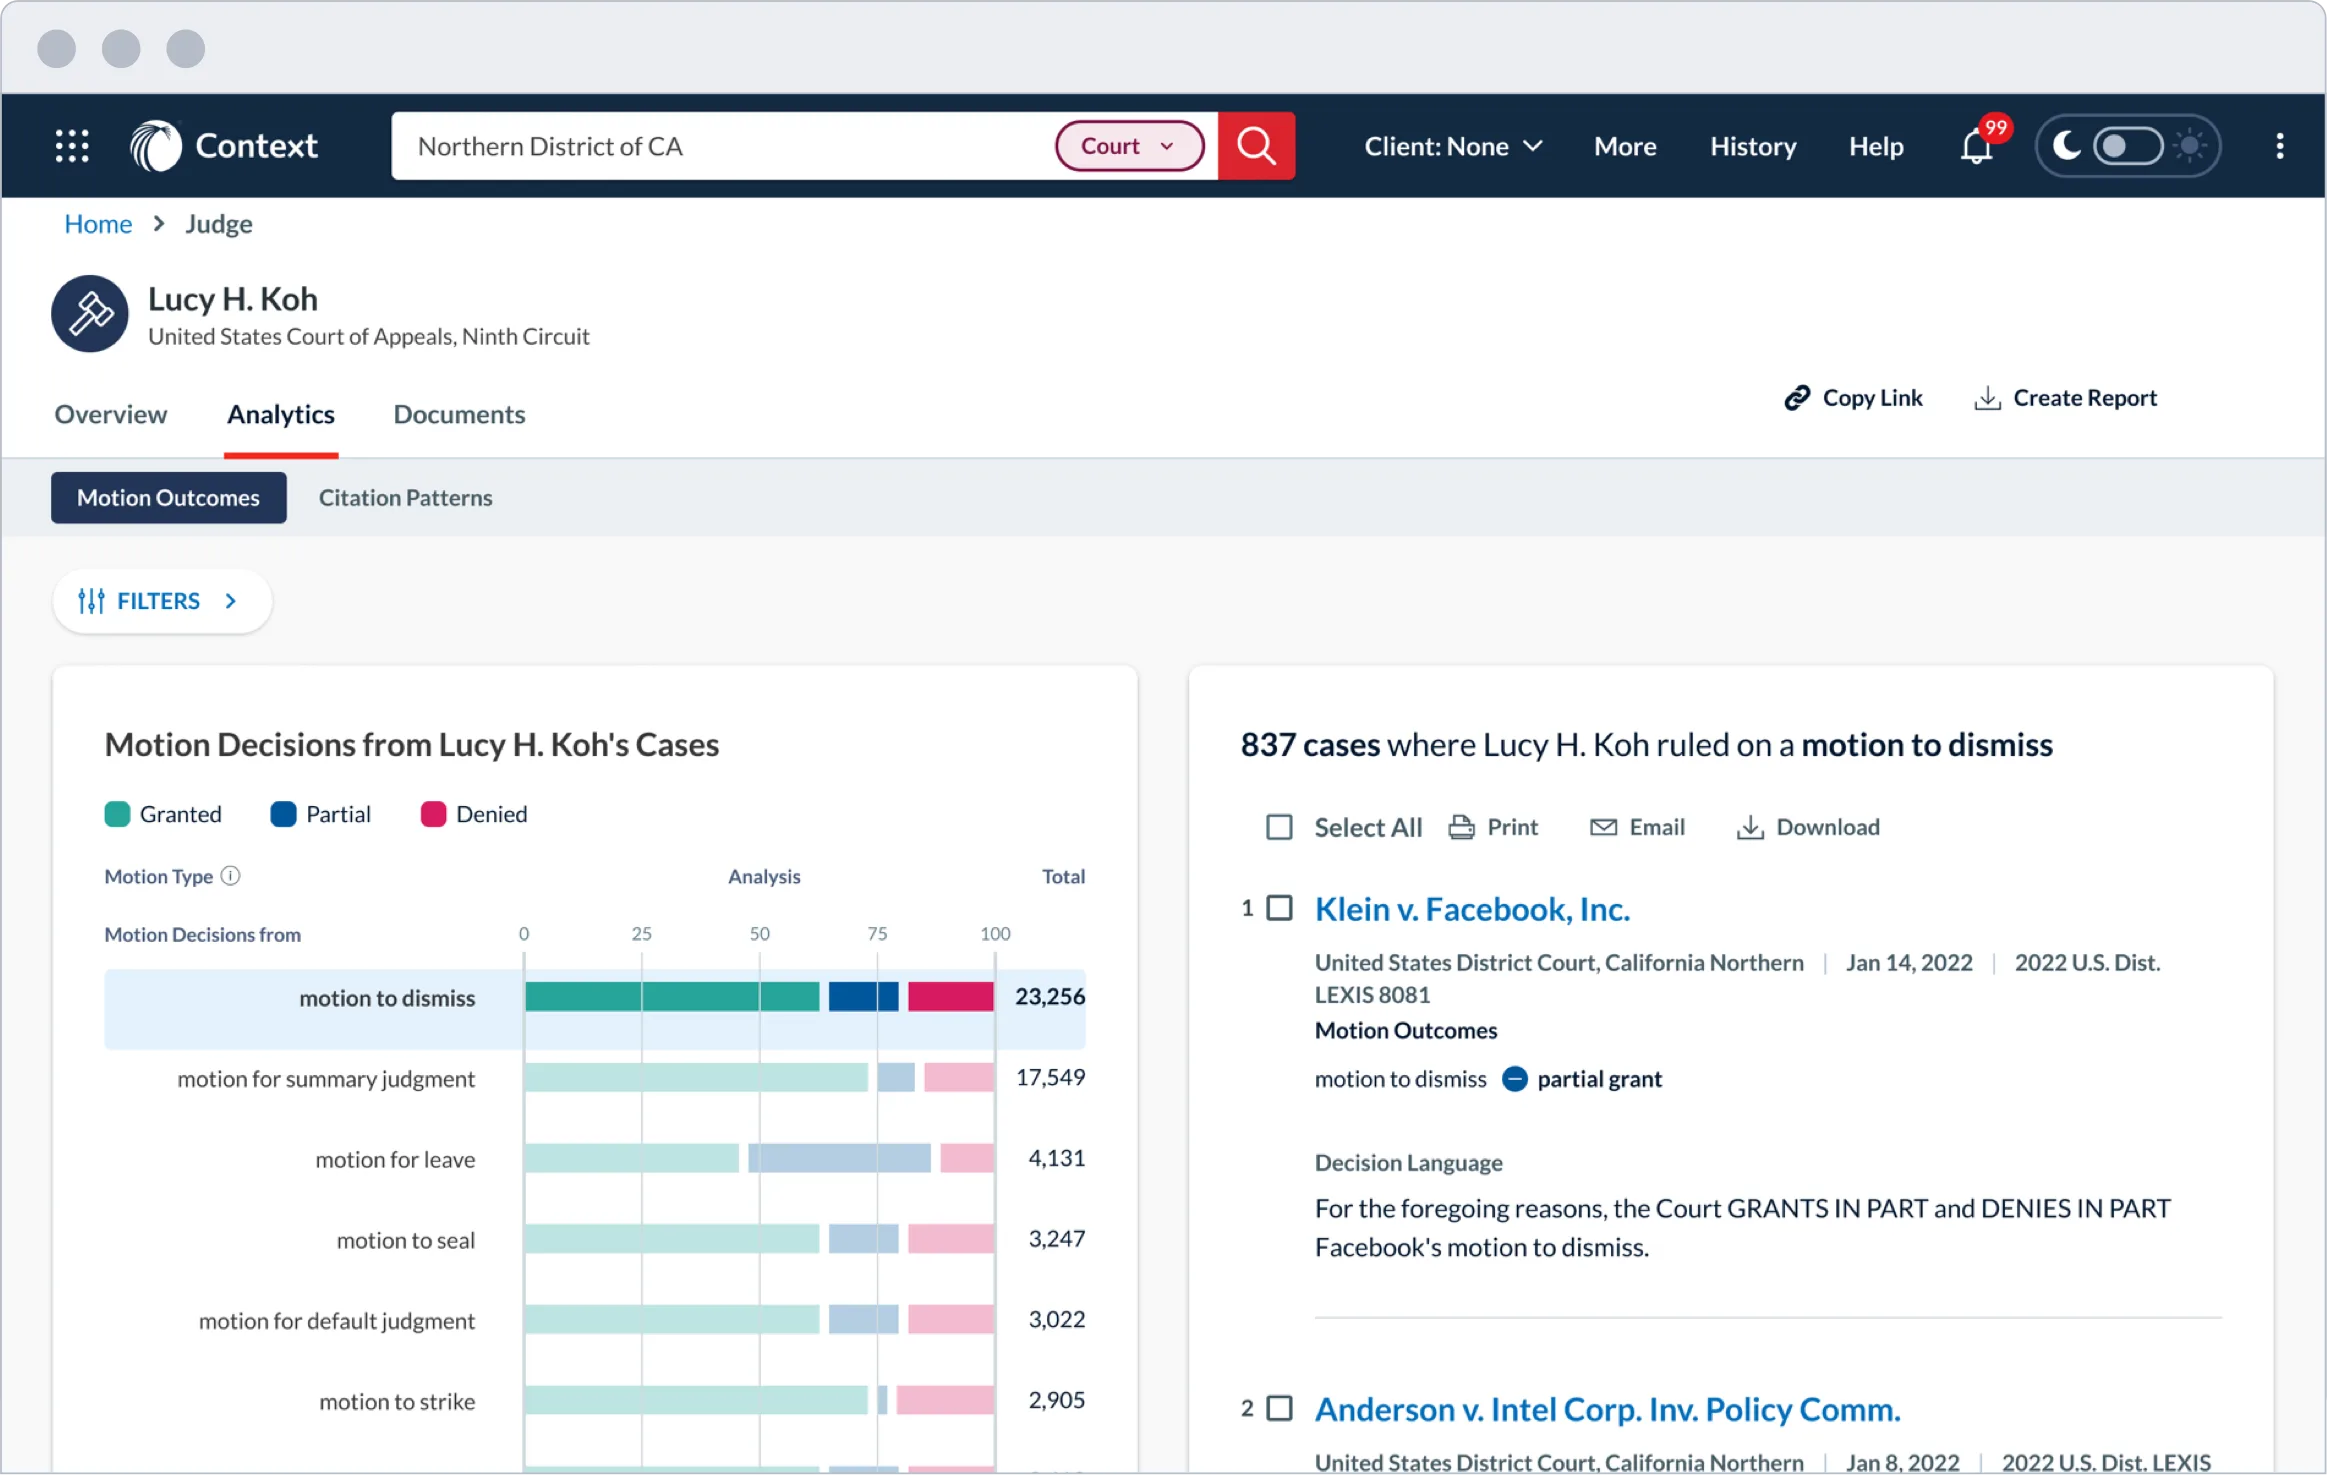
There’s a variety of chart data that is shown differently as bar charts, line charts, heat maps, and filled charts.
1. Charts don’t support WCAG standards due to the lack of auditing each year.
2. The text shown within each chart appears too small to read.
3. The charts themselves are not interactive until clicked and even then, they take you to a new page instead of showing data.
After learning more about the LN color palette, I focused on matching each color as close as possible to what I already had implemented. In my process, I discovered that some colors needed adjustments due to particular colors being too dark or too light for WCAG standards.
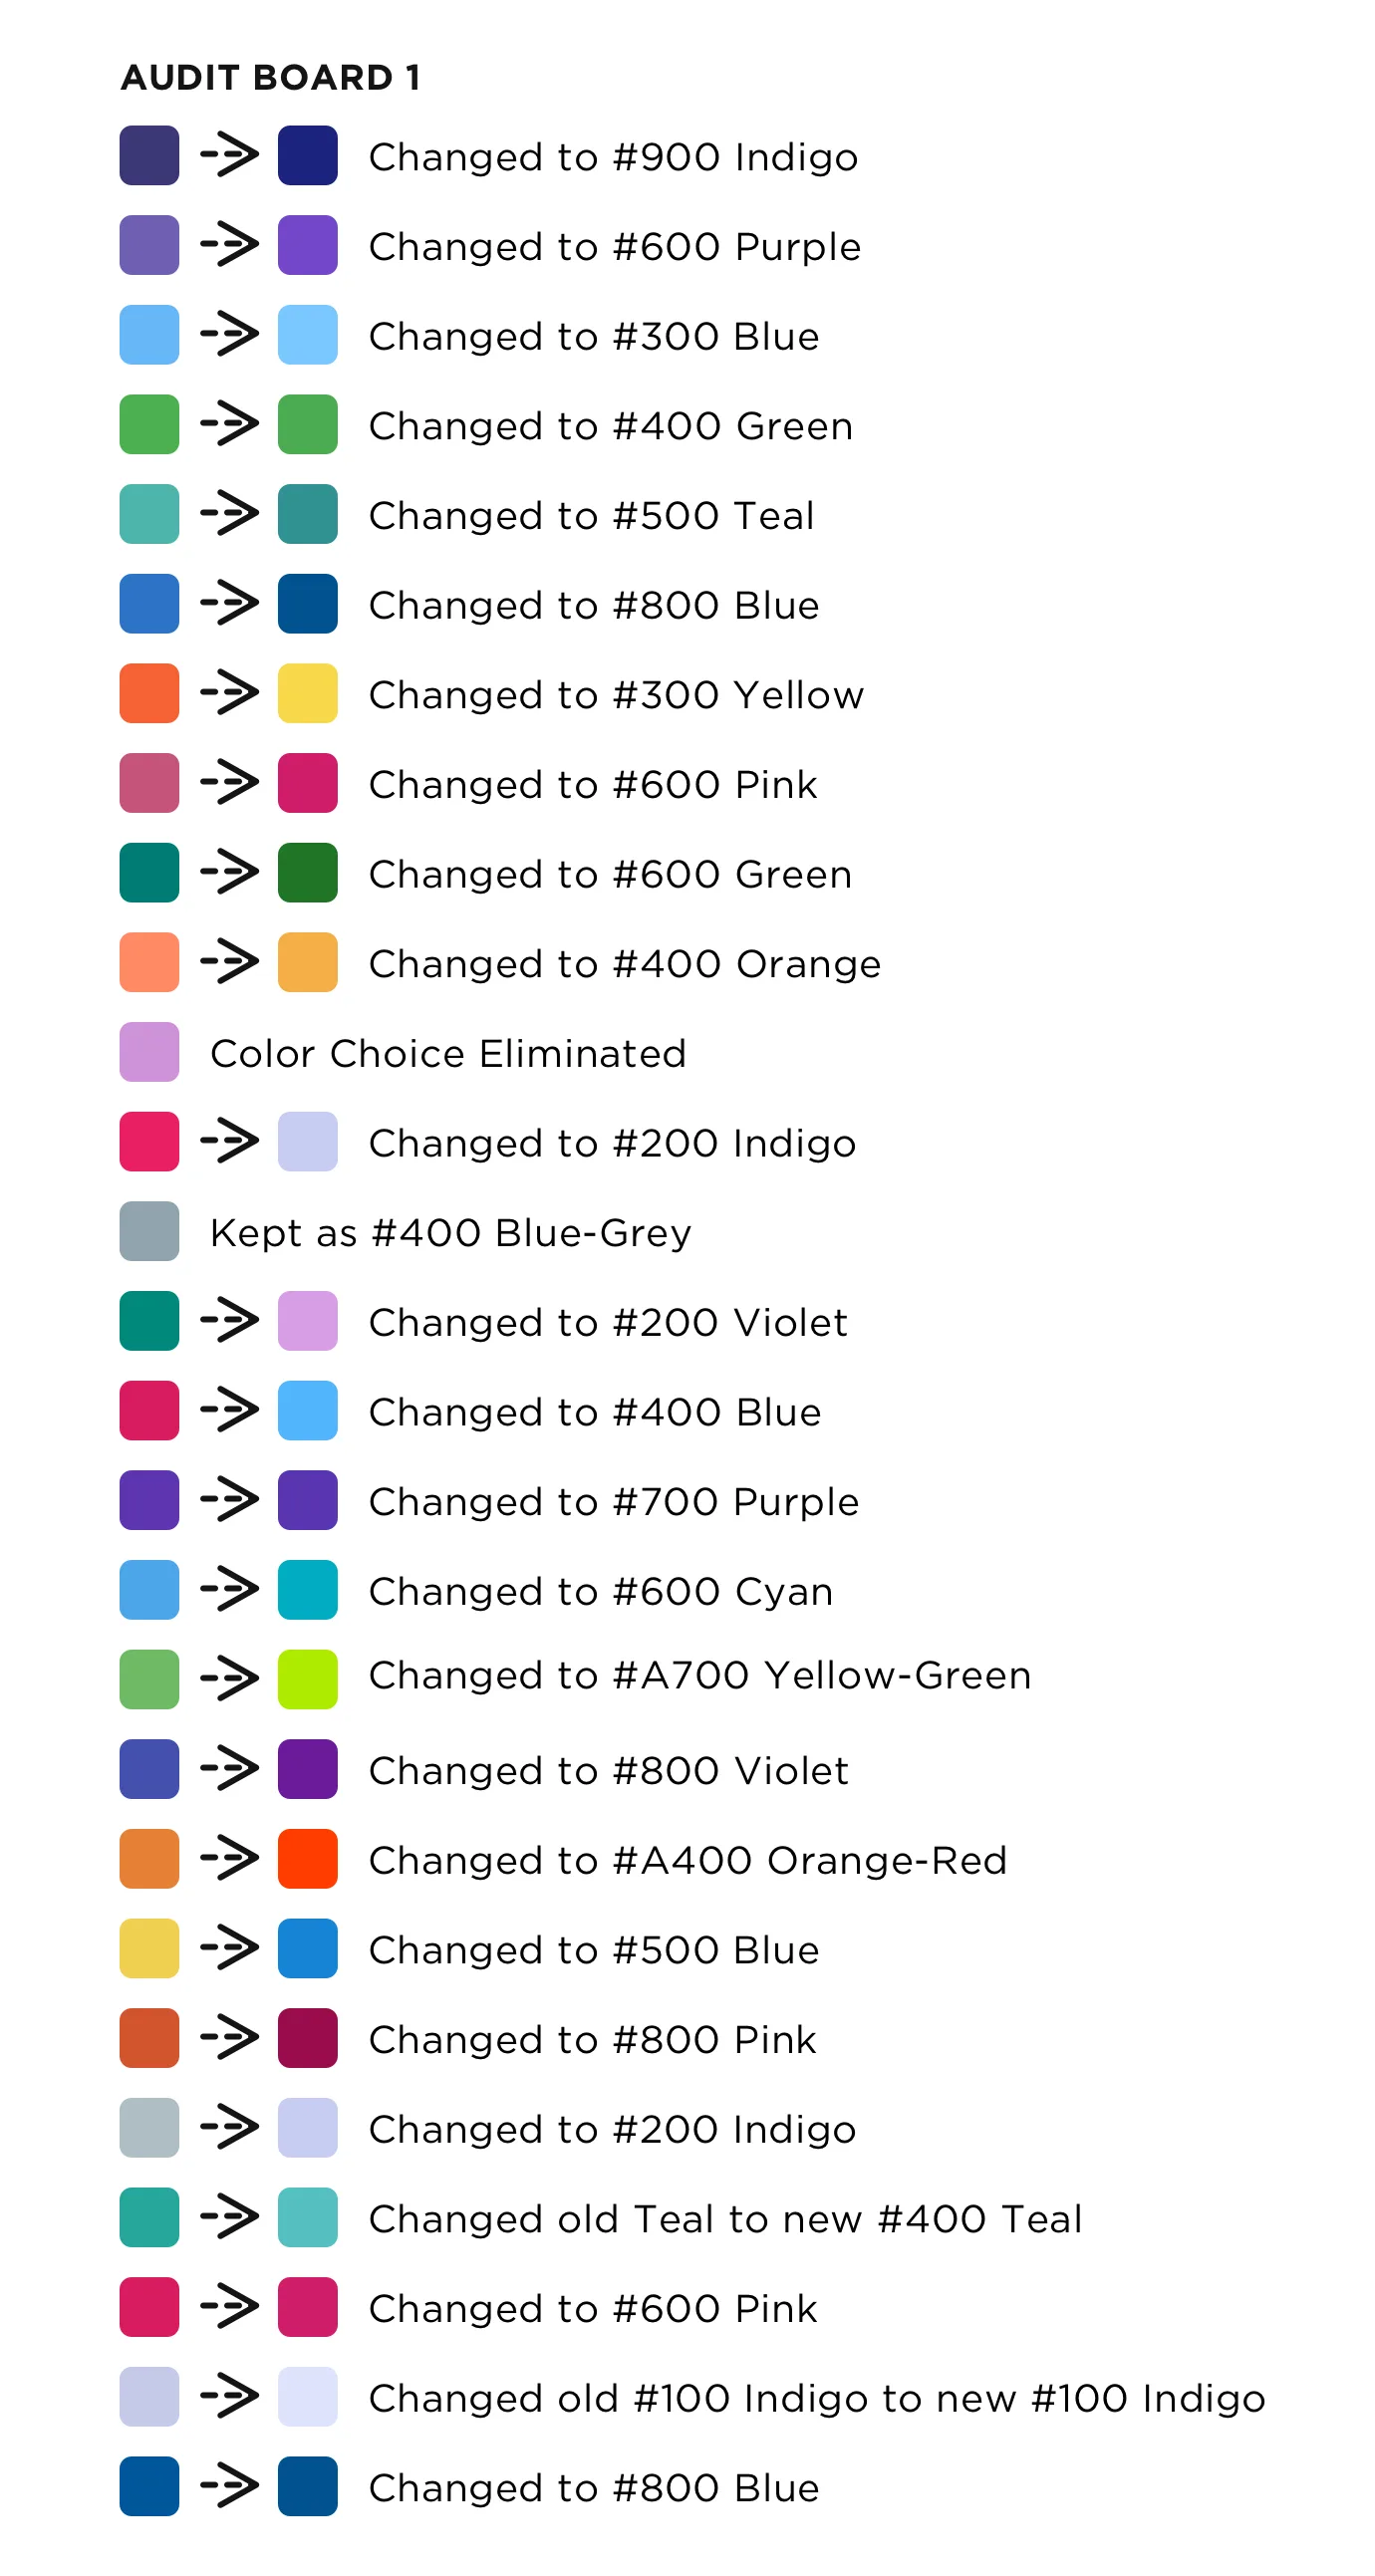
1. Category Unknown: The initial #100 replacement color appeared too light so I used the #200 color with a blue-grey tone as a replacement.
2. Lex Machina Categories: Cases was the only color that was ADA compliant, I explored using the extended accent colors that could work for graphs and are also recognizable.
Category Colors: The goal is to synchronize color with a category that will work for every product.
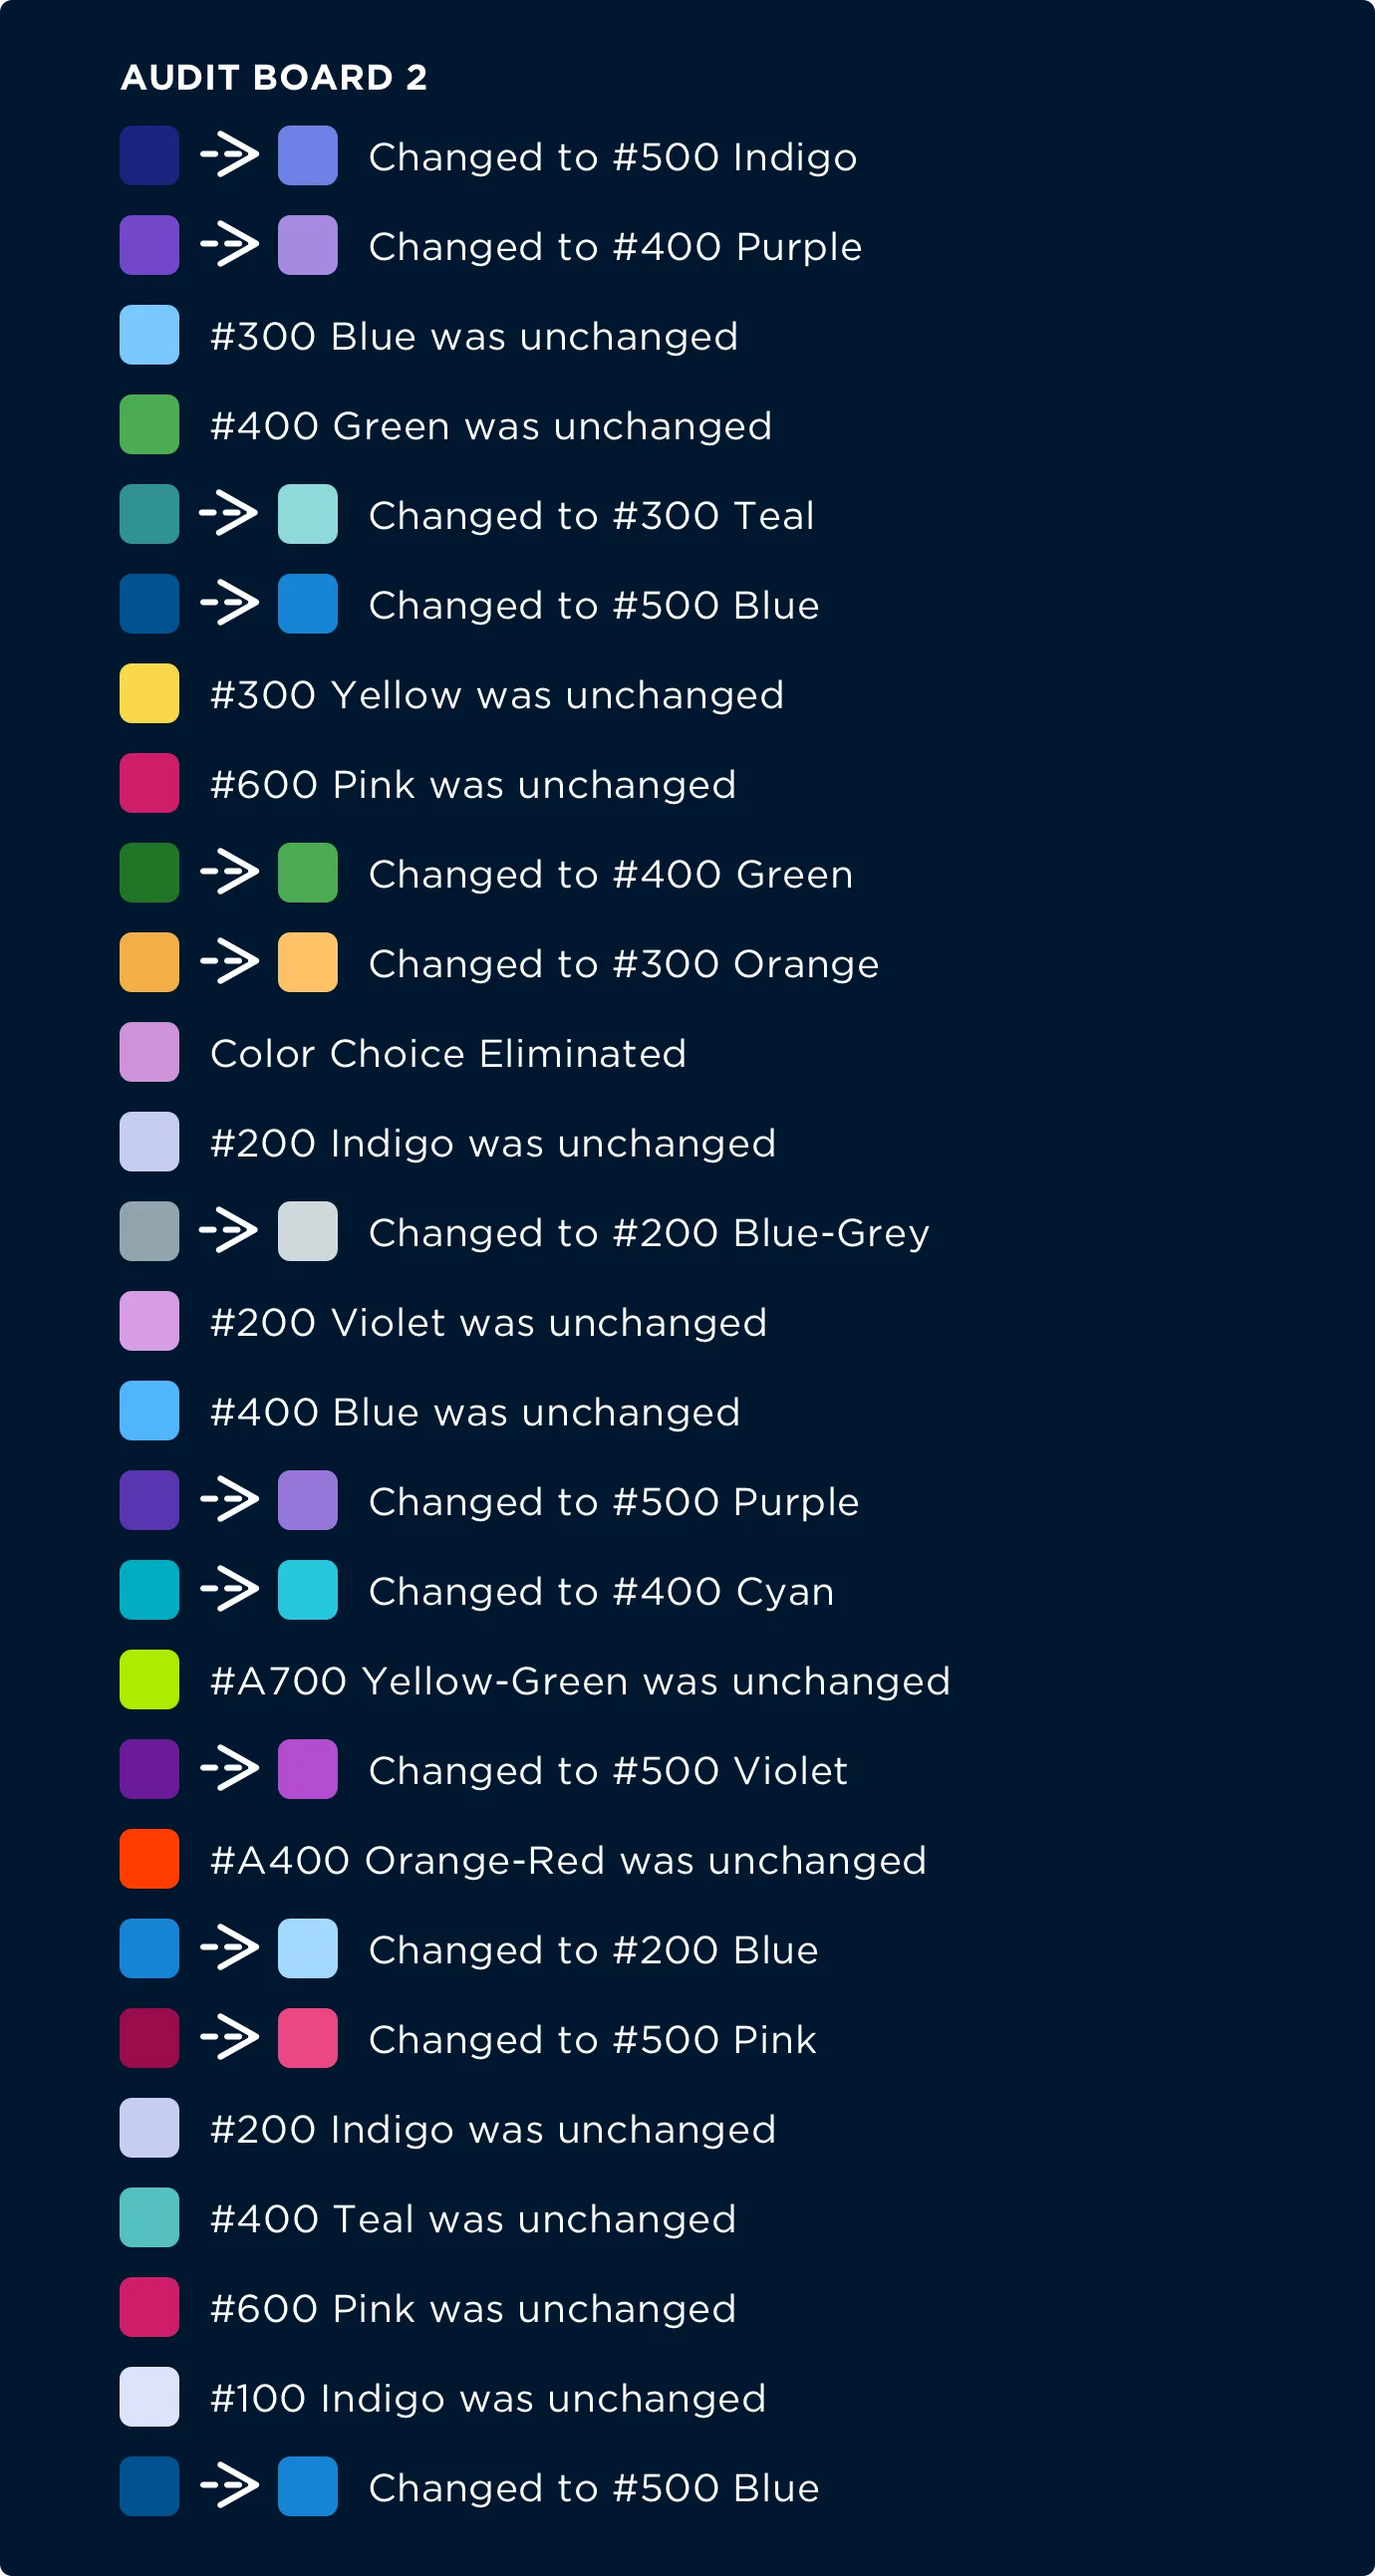
Some colors appear too dark. Colors #900 Indigo, #600 Purple, and #800 Blue shown above don’t appear as well in dark mode as they do in light mode.
I made HSL adjustments to all colors for dark-mode. It is possible to make adjustments to some or all colors that appear in dark-mode analytics. It’s equally important for each color to be differentiated enough to be distinguished as its own color for ADA compliance.
With the palette adjusted, I applied each color to real chart scenarios in light and dark mode to confirm the categories stayed distinct and readable.
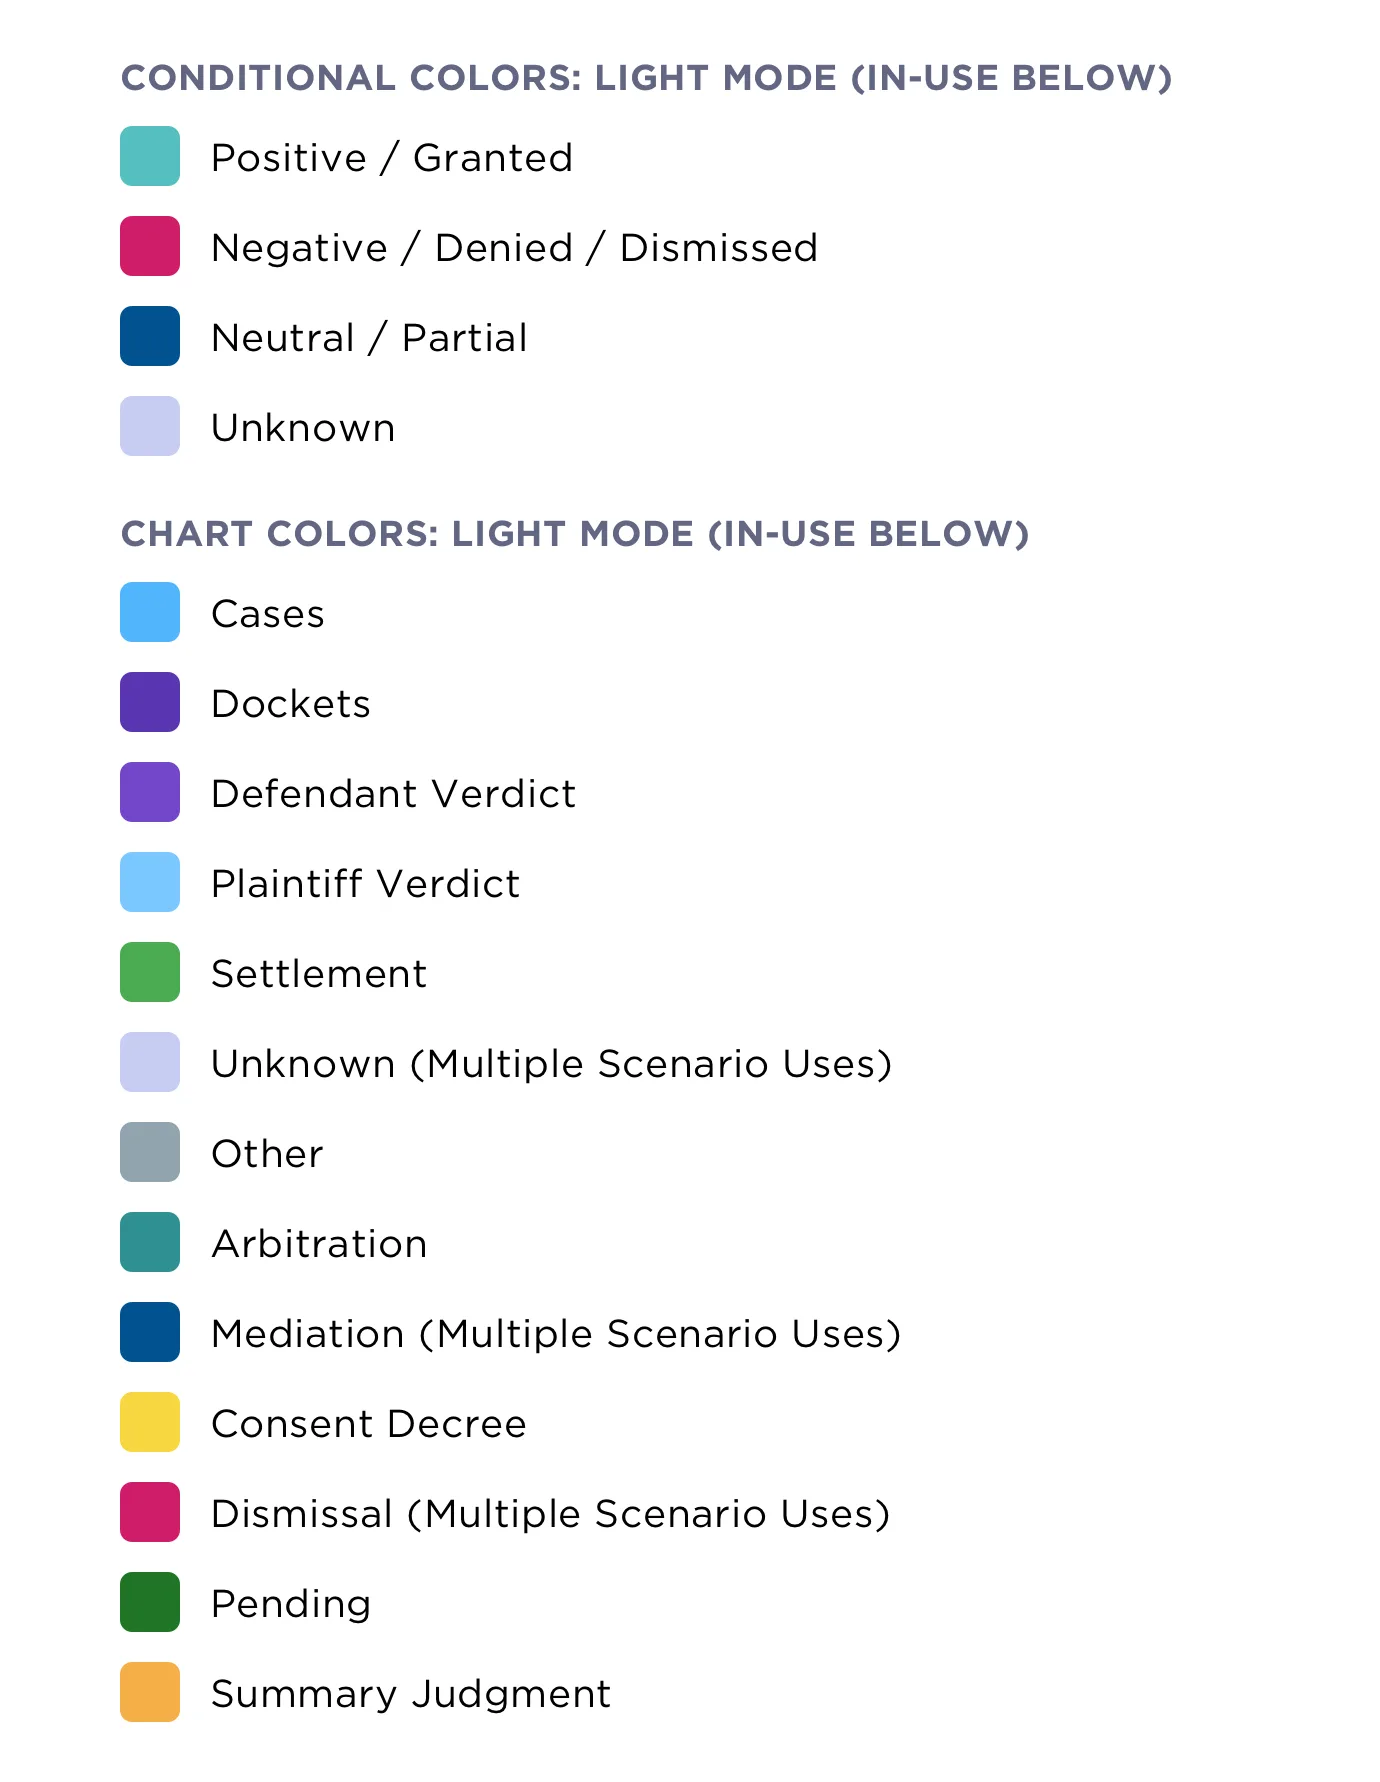
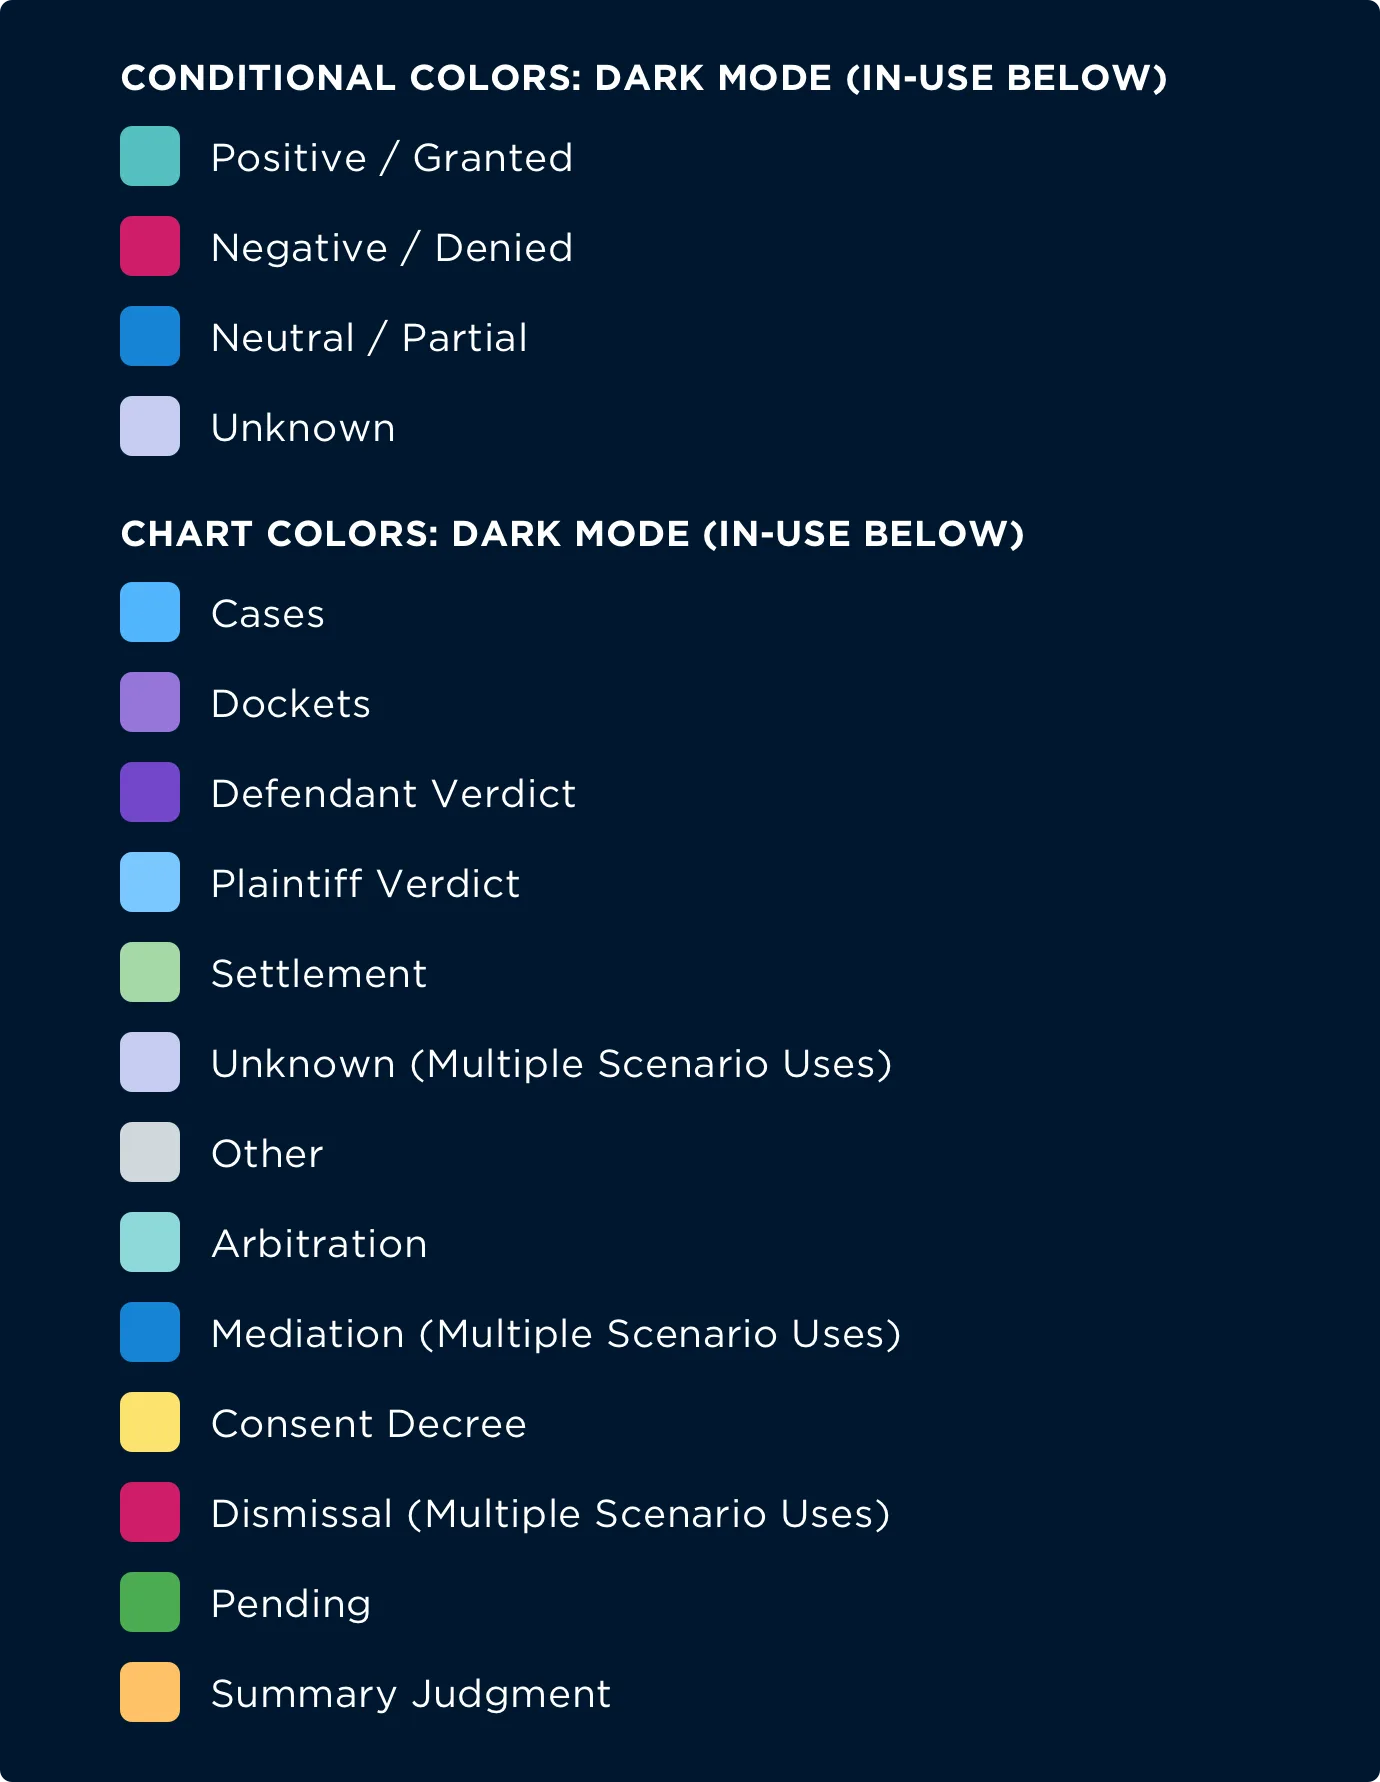
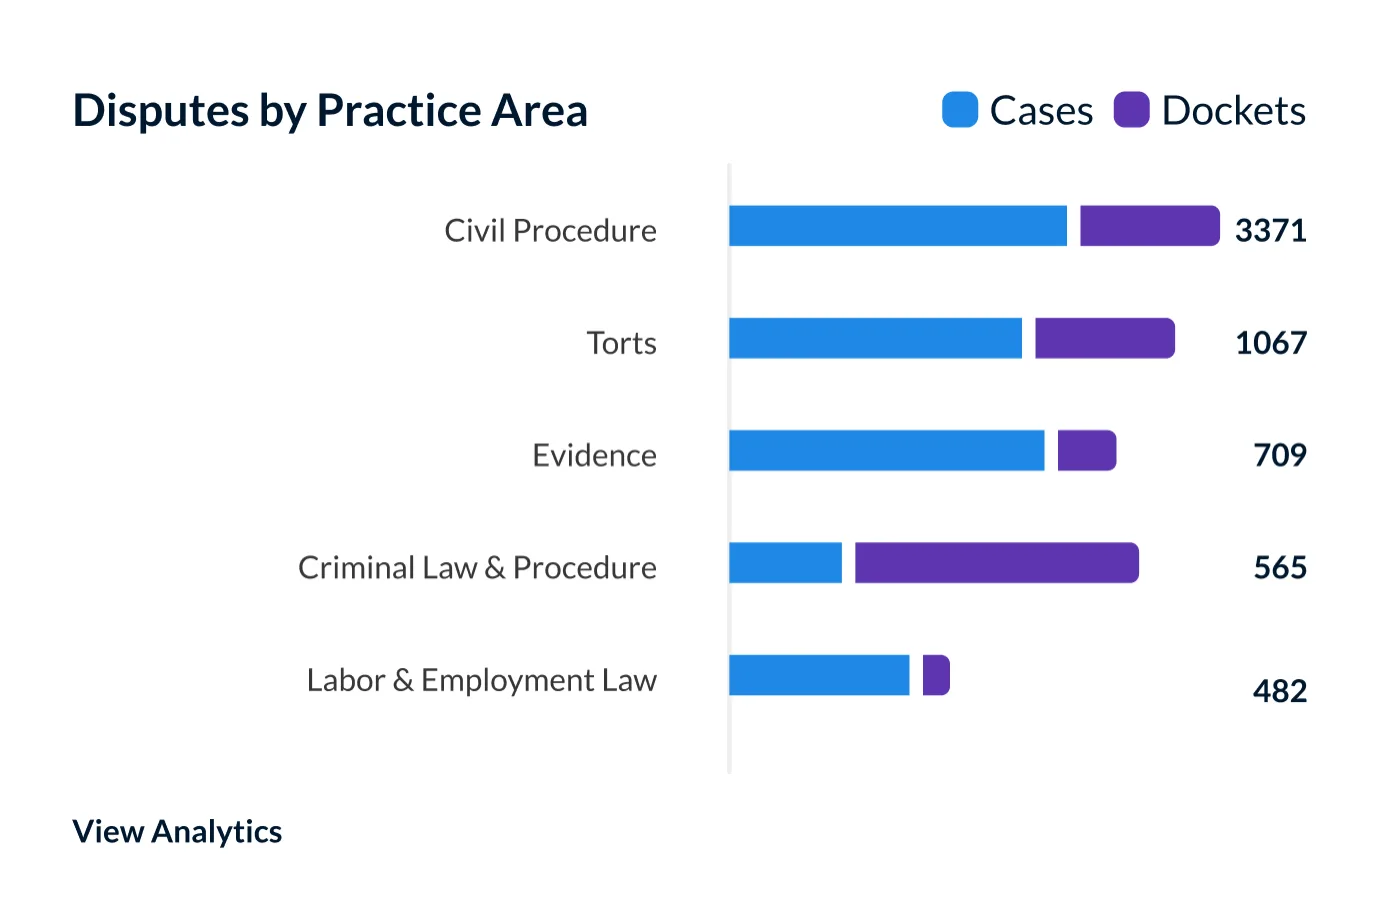
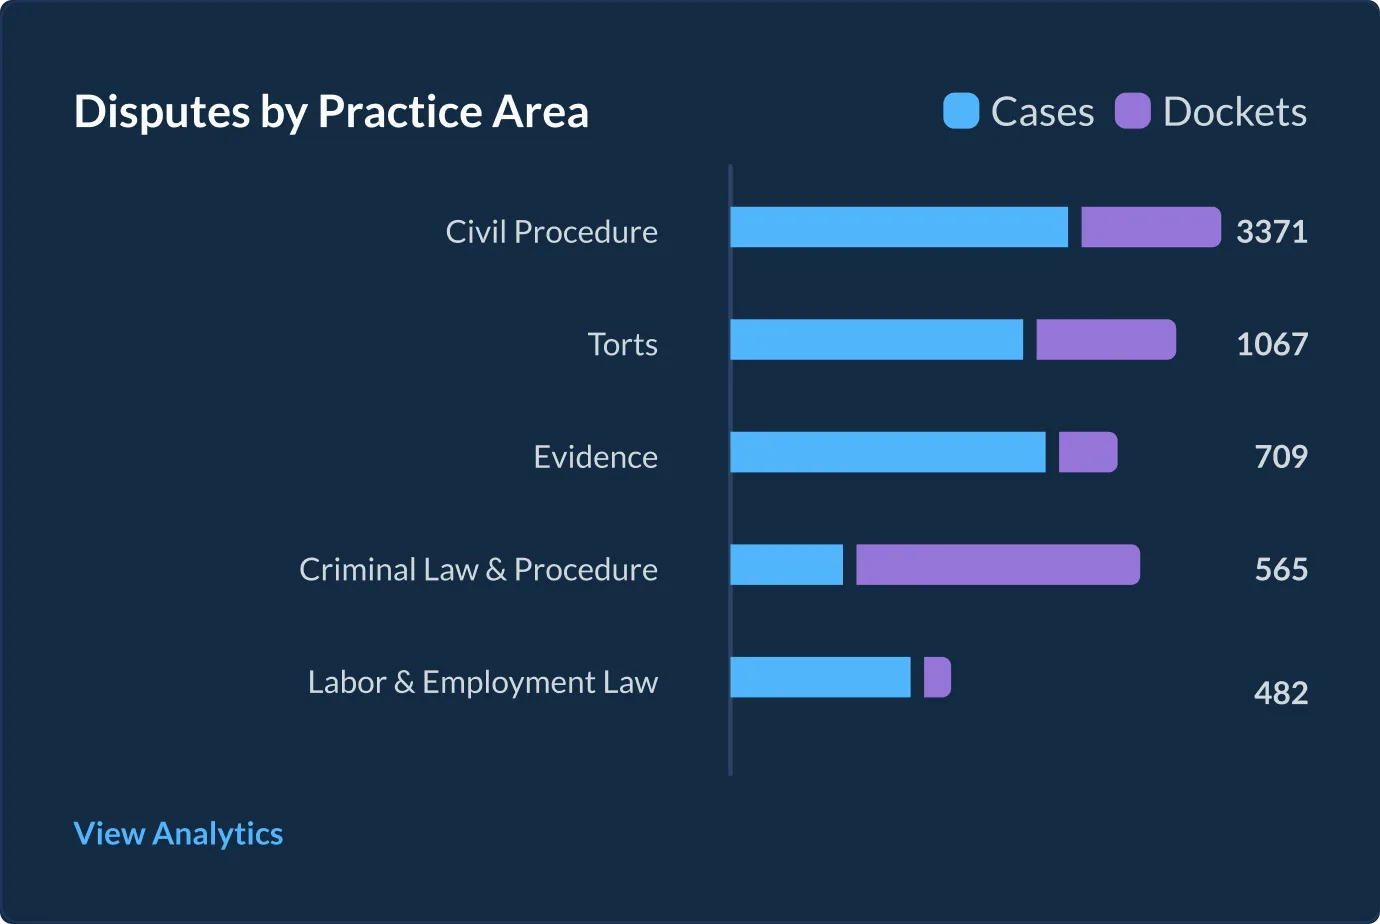
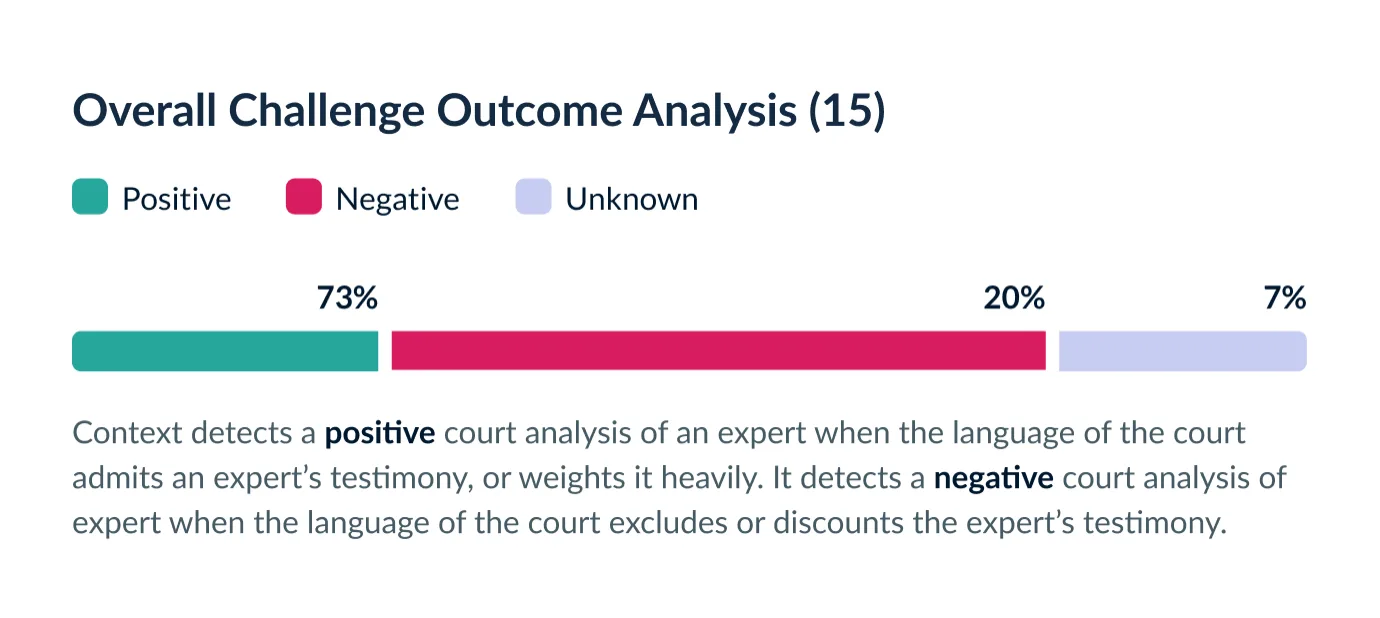
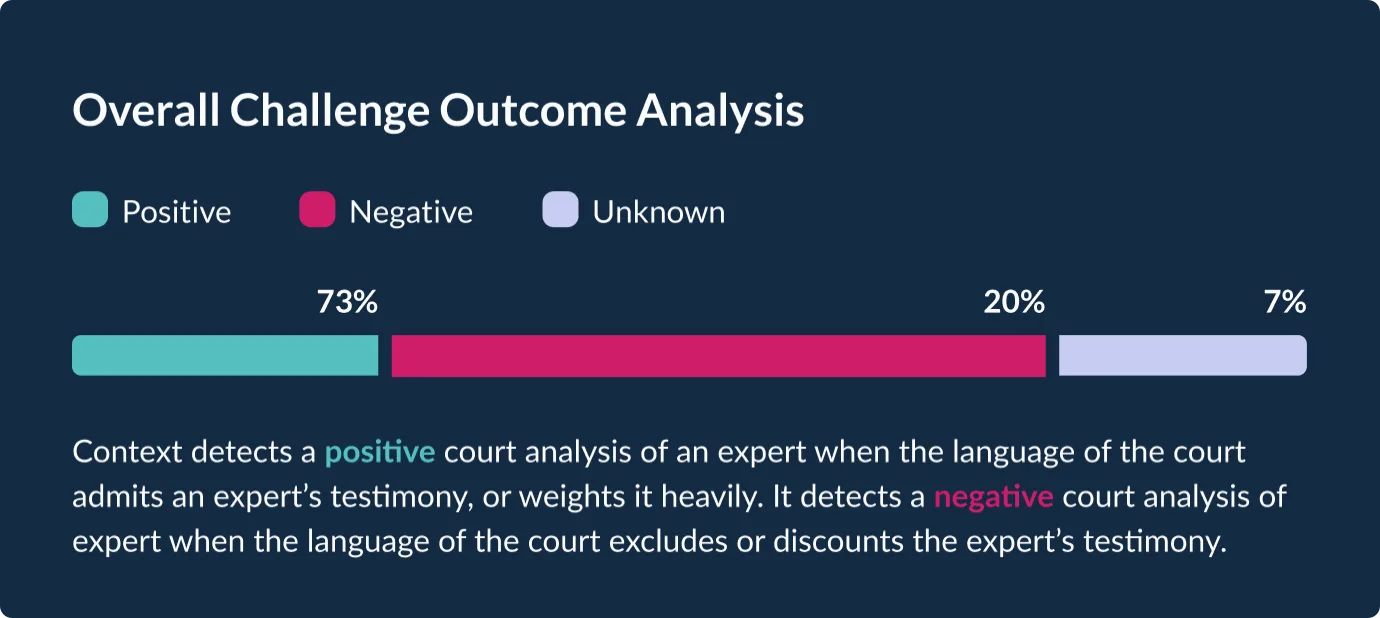
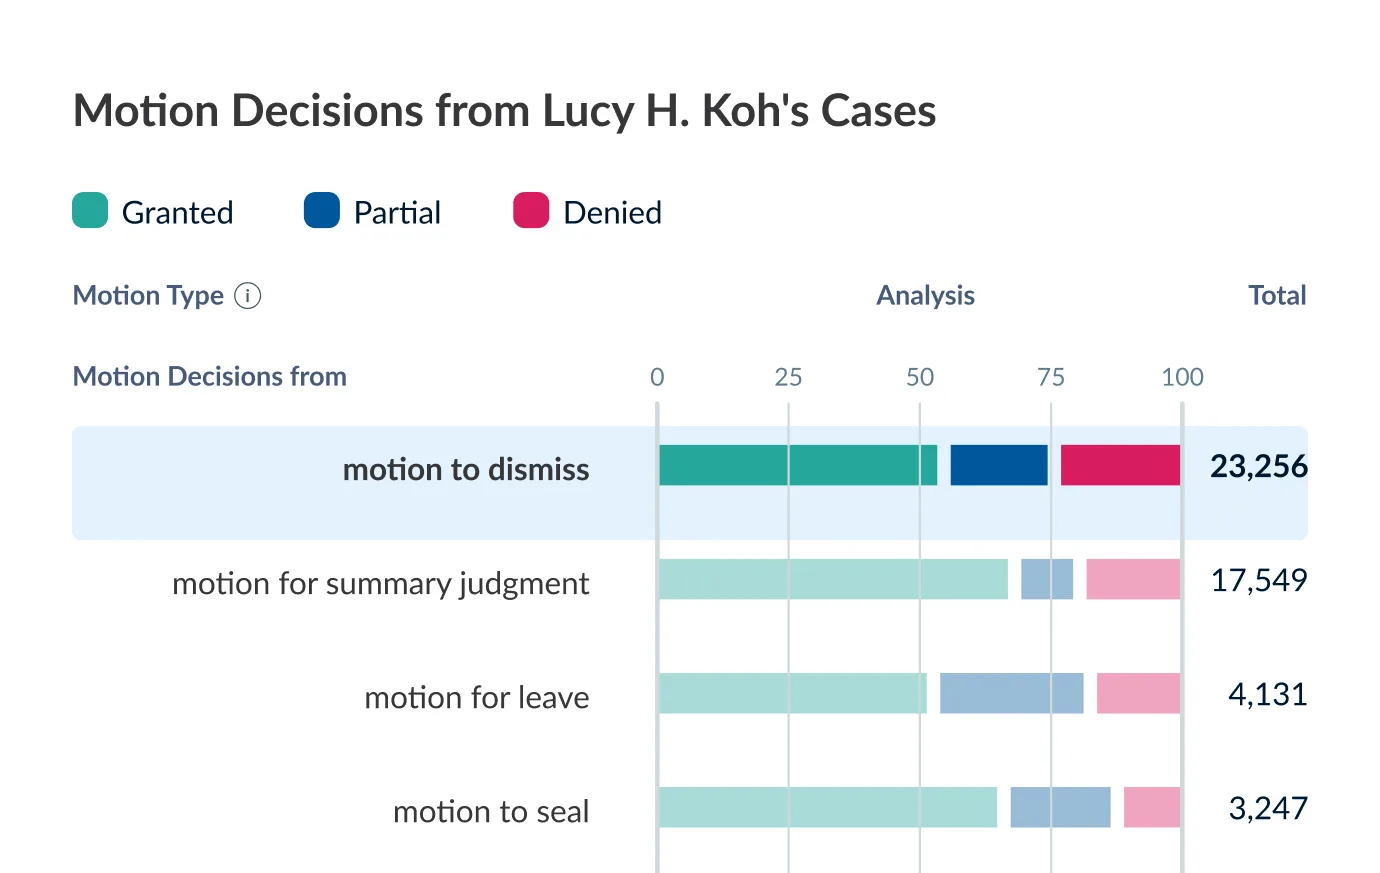
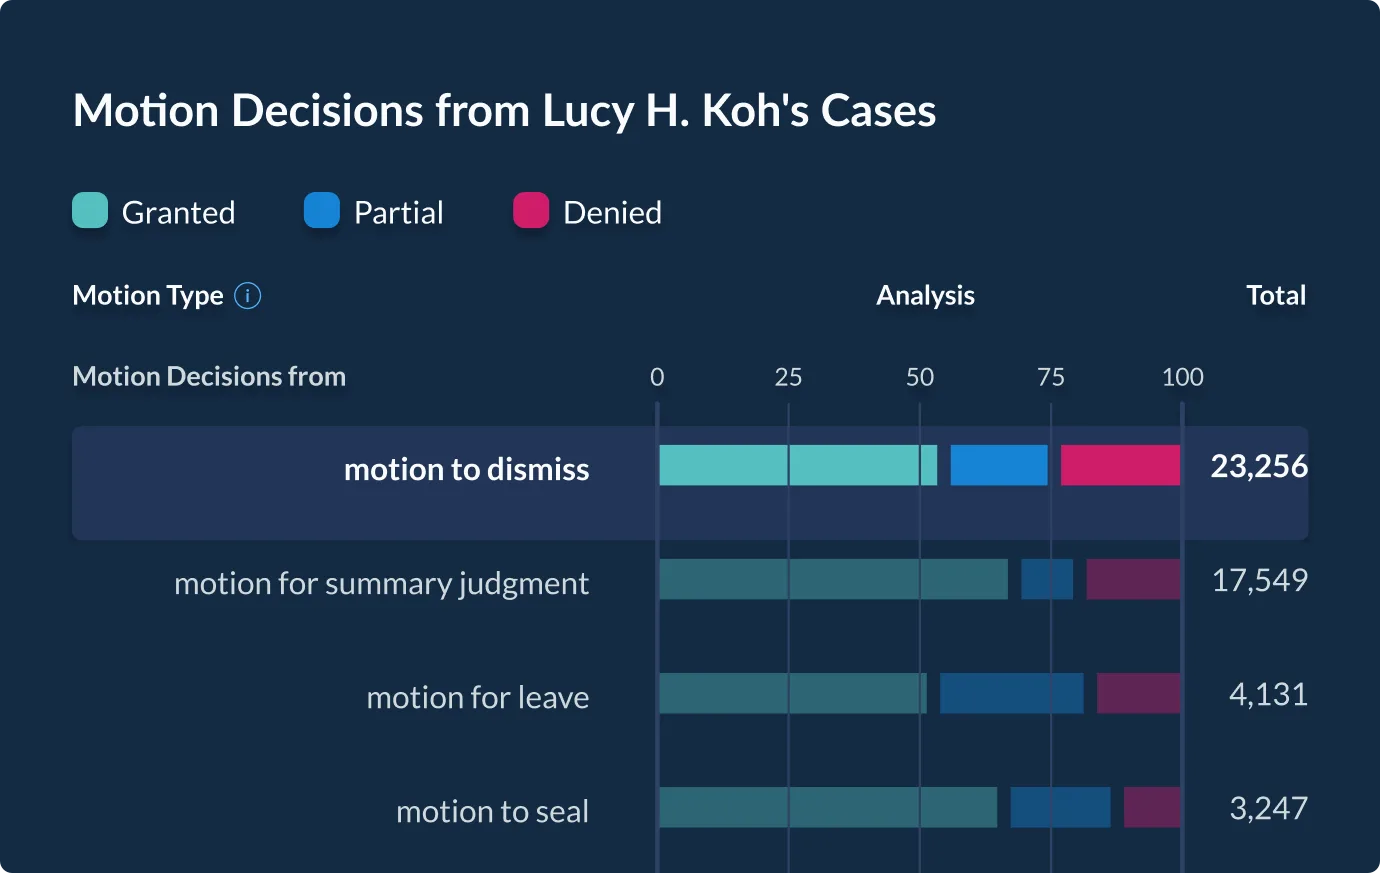
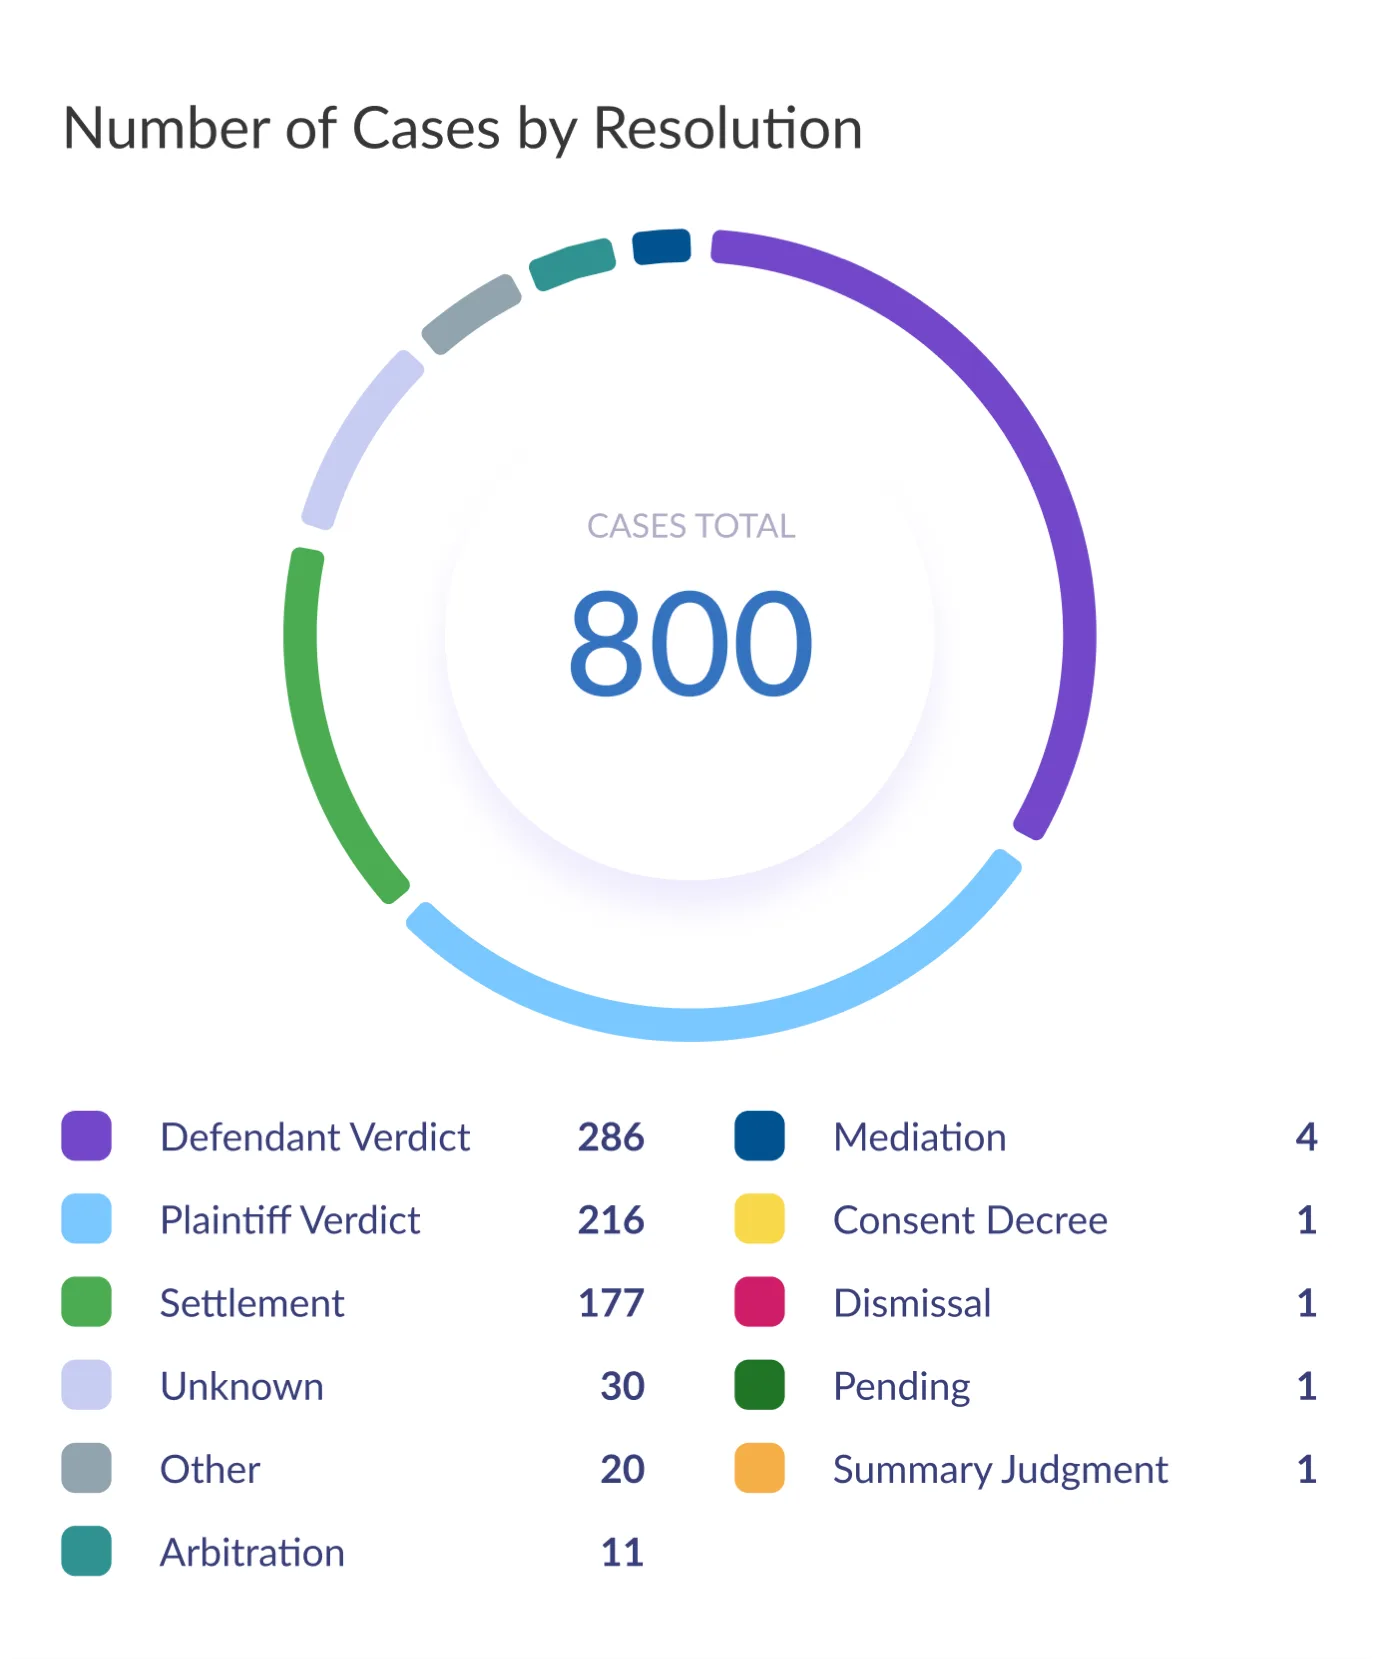
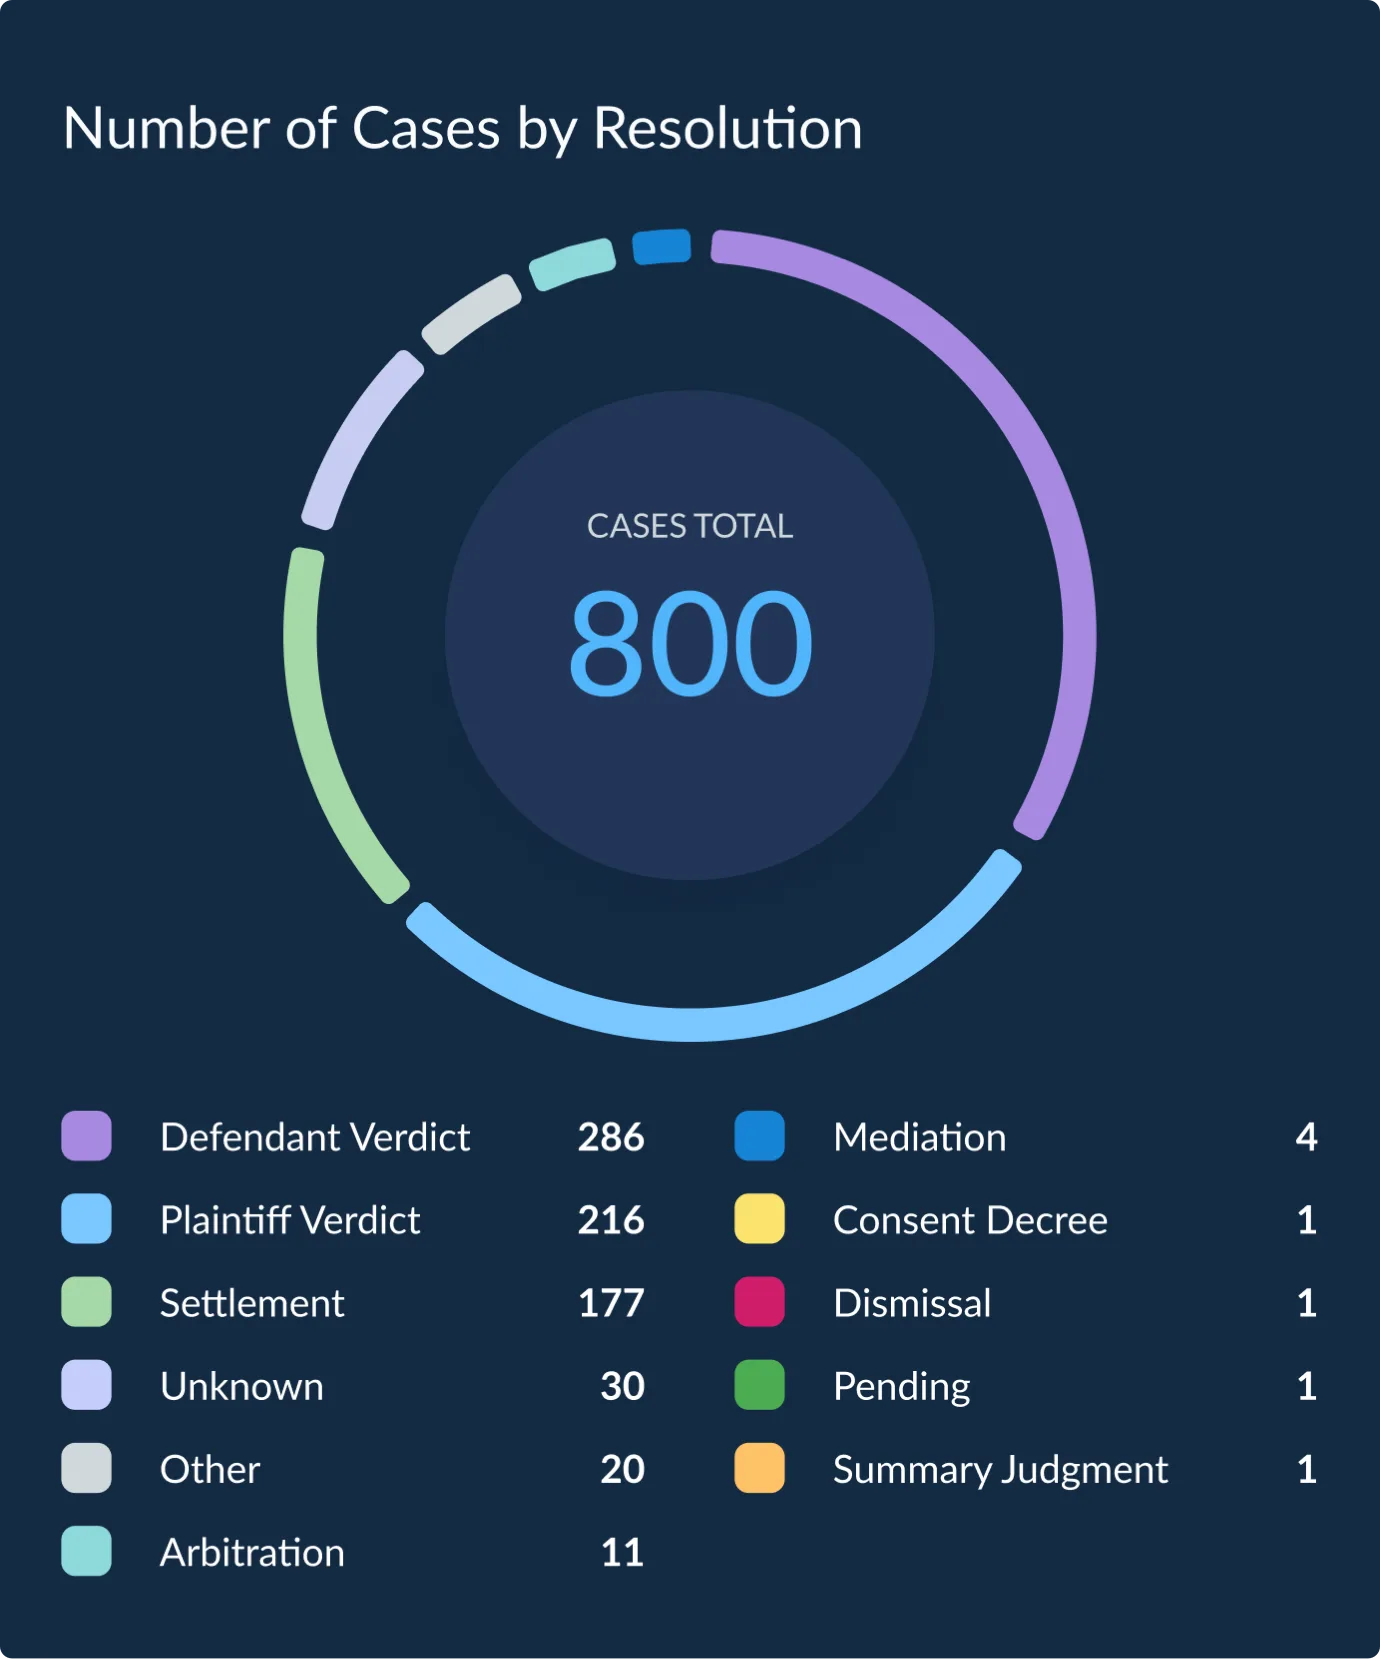
Each color is distinguished by a category, often showing in a chart with a name next to a rounded-square. Each category color has a companion color for dark-mode.






















Role Product design, visual design, UI design, and design systems
Completed 2013 to 2024 while at LexisNexis
Collaboration Nicole Gottwald (Guided Search Entry)

Previous case

Next case